
Unit session percentage measures units ordered divided by sessions, multiplied by 100, showing how many units you sell for every 100 visits to your product page. It is the default conversion metric inside Amazon Business Reports and sits alongside Order Session Percentage as one of the clearest signals of listing performance. Get the formula right and you can spot weak listings, wasted ad spend, and genuine wins fast.
TL;DR:
- Tracking and analyzing organic sessions separately from paid traffic is crucial because PPC can inflate unit session percentage and mask organic listing performance.
- Using both unit session percentage and order session percentage together provides a clearer picture of true listing health and visitor-to-buyer conversion rate.
- Improving listing visuals, rewriting bullets, and optimizing pricing and promotions directly increase units per order, boosting overall performance metrics.
- Manual calculation is tedious; automated tools like Osellpa help sellers properly distinguish paid from organic sessions, optimizing PPC spend against profit margin.
- Sustained high unit session percentage over time, combined with a healthy order session rate and verified profit per unit, signals genuine listing strength worth scaling.
Table of Contents
- What is unit session percentage and how does Amazon calculate it?
- Unit session percentage versus conversion rate and Order Session Percentage
- Where to find it in Seller Central and why sessions blend paid and organic traffic
- What counts as a good unit session percentage?
- Common pitfalls: USP over 100%, PPC mixing, and misread variations
- How to improve unit session percentage on and off Amazon
- Worked example: calculating USP against Order Session Percentage
- How Osellpa turns raw USP numbers into decisions
- When unit session percentage should drive your next move
- Osellpa: separate the signal from the noise in your USP data
- Where to check the numbers yourself
- Sources
What is unit session percentage and how does Amazon calculate it?
The formula is straightforward: Unit Session Percentage = (Units ordered ÷ Sessions) × 100.
Two definitions trip sellers up constantly:
- Units versus orders — a single order for three identical items counts as three units, not one, which pushes USP higher than a straightforward “did they buy?” metric would suggest.
- Sessions versus visits — Amazon counts a session as all activity from one visitor within a 24 hour window, so someone who bounces between tabs five times in one day still registers as a single session.
- Parent/child ASINs — variation listings can report sessions at the parent level while units get attributed to the child, which distorts USP if you are not viewing the right report tier.
Unit session percentage versus conversion rate and Order Session Percentage
Sellers often use “conversion rate” loosely, but on Amazon it usually means one of three different things, and mixing them up leads to bad decisions.
- Unit Session Percentage counts units sold per session, so bulk purchases inflate it.
- Order Session Percentage counts orders per session and cannot exceed 100%, giving a cleaner read on how many distinct visitors actually bought something.
- Conversion rate in advertising reports typically means orders per click, a narrower slice that ignores organic sessions entirely.
Order Session Percentage caps at 100% and often gives a clearer per-visitor conversion picture than USP alone. Lean on USP when you care about volume and revenue per visit; switch to Order Session Percentage when you want to know what share of visitors converted at all, particularly when comparing listings with very different pack sizes.
Where to find it in Seller Central and why sessions blend paid and organic traffic
You will find Unit Session Percentage inside Business Reports, and Amazon’s own seller community points sellers to the same location when the question comes up. To pull it correctly:
- Go to Reports → Business Reports in Seller Central.
- Open Detail Page Sales and Traffic by Child Item (or Parent Item, depending on what you’re analysing).
- Select your date range and export the ASIN-level breakdown, which includes sessions, units ordered, and USP side by side.
That session count blends every visitor, whether they arrived through a sponsored ad, organic search, or an external link. That blending is precisely why a strong headline USP can hide a weak organic listing propped up entirely by advertising.
What counts as a good unit session percentage?
Benchmarks vary by category, but sellers often use qualitative thresholds such as high values indicating strong listings, moderate values considered average, and low values suggesting issues worth investigating.
These ranges come with real caveats. Pair any benchmark reading with Order Session Percentage and your profit-per-unit figures before deciding a listing is genuinely healthy.
Common pitfalls: USP over 100%, PPC mixing, and misread variations
A handful of mistakes account for most of the confusion sellers report with this metric.
That is not an error. It simply means average units per order exceeds one, which Order Session Percentage will confirm by staying properly bounded.
Paid traffic masking organic weakness. USP blends every session, paid and organic, into one number. A listing running aggressive PPC can show a respectable USP while its actual organic conversion is mediocre.
Fixes worth applying:
- Activate and check Order Session Percentage alongside USP for every ASIN you review.
- Align your Business Report window and your Advertising Report window to the same dates before comparing anything.
- Check parent and child ASIN views separately when a listing has variations.
- Subtract PPC clicks and PPC orders from your totals to isolate an organic-only conversion figure.
Pro Tip: Run the same date range through Business Reports and Advertising Reports, then subtract PPC clicks and orders from your session and unit totals. What’s left is your true organic conversion, and it’s often lower than the headline USP suggests.
How to improve unit session percentage on and off Amazon
Raising USP means giving more visitors a reason to buy, and buy more, once they land on your page. Work through these in order.
- Fix the visual first impression. Add lifestyle images, infographics, and comparison charts; listings with richer imagery and A+ Content consistently convert better than text-only pages.
- Rewrite bullets around objections, not features. Answer the questions buyers actually have before they scroll to reviews.
- Test pricing and promotions. Coupons, Lightning Deals, and bundles all push units-per-order up, which lifts USP directly.
- Build a genuine review base. Use automated, policy-compliant review requests rather than chasing reviews manually.
- Win and hold the Buy Box. A listing losing the Buy Box intermittently will show session activity with no corresponding units.
- Improve traffic quality off Amazon. Targeted social ads, relevant influencer placements, and email campaigns that send warm buyers, not browsers, all lift USP more reliably than generic traffic pushes.
Pro Tip: Change one variable at a time. Update your main image this week, hold everything else steady, and compare USP and Order Session Percentage across two matching date windows before touching anything else.
Measurement discipline matters as much as the changes themselves. A/B test listing changes where Amazon’s tools allow it, track both USP and Order Session Percentage in parallel, and always check profit per unit before calling a test a win. A change that lifts USP but erodes margin through deeper discounting is not an improvement.
Worked example: calculating USP against Order Session Percentage
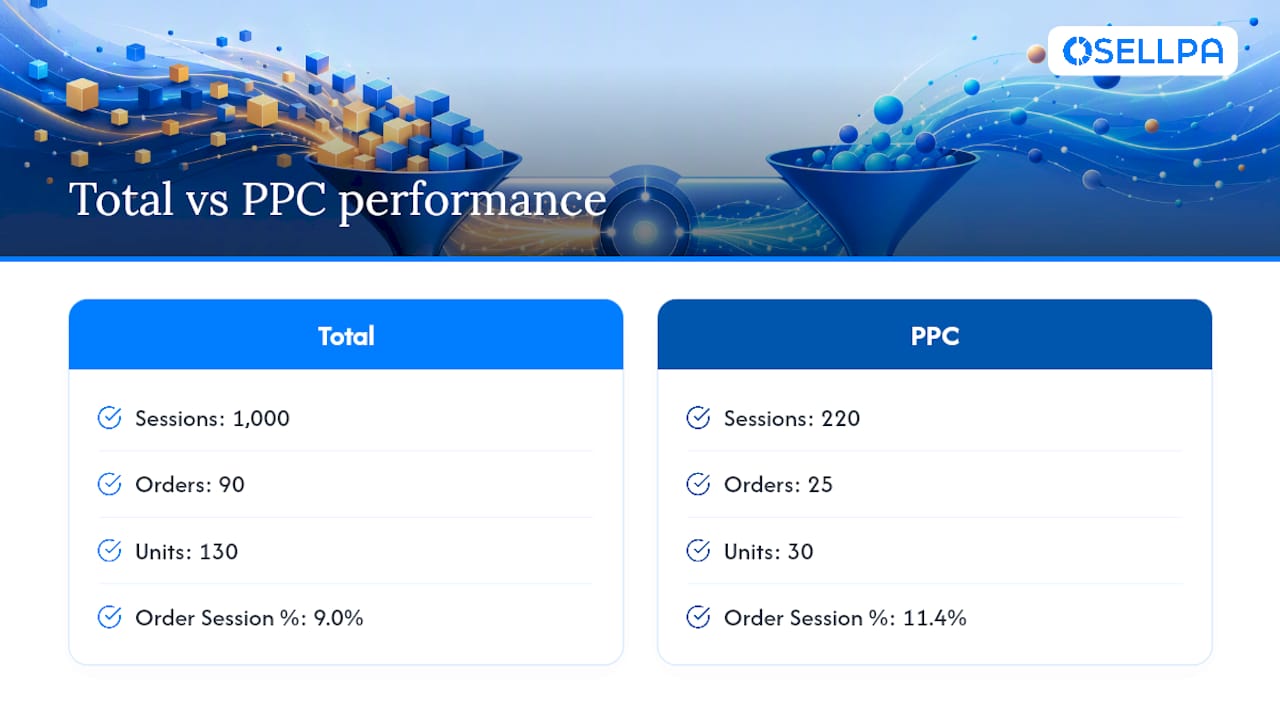
Take a listing with 1,000 sessions in a week, 220 of which came through PPC clicks. It generated 90 orders and 130 units sold, with PPC responsible for 25 of those orders and 30 of those units.
The next step is checking whether that PPC spend is profitable enough to justify the sessions it’s buying.
How Osellpa turns raw USP numbers into decisions
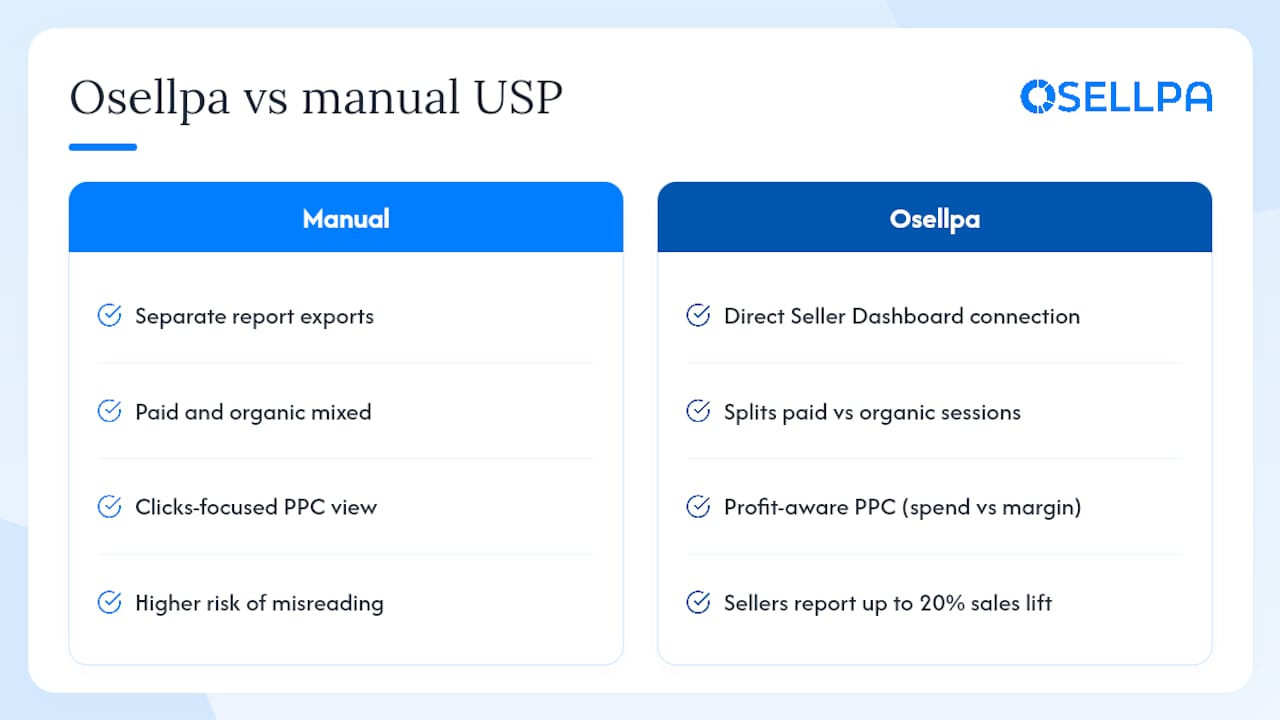
Separating paid from organic sessions by hand, aligning report windows, and re-checking parent/child data every time you test a listing change gets tedious fast. Analytics platforms built specifically for Amazon data solve this by pulling Business Reports and Advertising Reports together automatically.
- Automatically split paid and organic sessions so USP reflects genuine listing performance, not ad spend.
- Track profit per unit alongside conversion, so a USP lift never gets celebrated if margin drops.
- Flag trend shifts after a listing change, so you know within days whether a test worked.
- Keep report windows aligned across advertising and sales data without manual exports.
When unit session percentage should drive your next move
USP earns your attention when it moves consistently across a full week or more, not a single day’s noise, and when you have already separated paid from organic sessions. Treat a single high reading with suspicion if it coincides with a promotion or a PPC surge; treat a sustained low reading as a genuine listing problem worth fixing. When in doubt, check Order Session Percentage and profit per unit before you touch a single bullet point or bid.
— Harry
Osellpa: separate the signal from the noise in your USP data
Chasing unit session percentage by hand, through spreadsheets and separate report exports, is exactly the kind of manual work that leads sellers to misread their own numbers. Osellpa connects directly to your Amazon Seller Dashboard and Analytics data, splitting paid and organic sessions automatically so your USP reflects real listing performance rather than advertising noise. Its profit-aware PPC optimisation tools track campaign spend against actual margin, not just clicks, so you never mistake a costly ad push for a genuine conversion win. Sellers using Osellpa’s tools report sales increases of up to 20% once they stop guessing which changes actually moved the needle. If you want a starting point, grab a free PPC bid optimisation report and see exactly where your paid traffic is helping, or hurting, your numbers.
Where to check the numbers yourself
Verify figures directly through Seller Central’s Business Reports, and understand session logic more broadly through Google’s engaged session definitions. Sellers wanting analytics fundamentals can also explore this web analytics course.


