
If a SKU is carrying more than 180 days of supply, or has sat for 365+ days with barely any sales, treat it as excess inventory now. Start with a short price or promotion test lasting seven to 30 days. If sales don’t recover, remove or liquidate the stock before storage fees and surcharges eat further into your margin.
TL;DR:
- Flag SKUs with over 180 days of supply for immediate action and treat items sitting 365+ days with little sales as candidates for liquidation.
- Use Amazon’s inventory reports and excess inventory flags to identify slow-moving stock, factoring in sell-through rate alongside days of supply.
- Prioritize cost-effective remedies like price cuts or promotions over liquidation, and model liquidation decisions against potential future storage costs.
- Automate weekly inventory health checks with tools that alert at 180 days, tracking profit margins to ensure swift removal before surcharges increase.
- Reorder based on trailing-90-day sales velocity and adjust safety stock to supplier lead times, preventing overstocking at the source.
Table of Contents
- Excess inventory Amazon reports actually show you
- Why unsold stock erodes your account and your profit
- How to clear excess stock without losing your margin
- Stopping the next batch of overstock before it happens
- Automating the checks so nothing slips past 180 days
- Rules for making the call without second-guessing yourself
- Turn this playbook into an automatic weekly routine
- Sources
Excess inventory Amazon reports actually show you
Amazon doesn’t leave you guessing. Open Inventory > Manage FBA Inventory, then check Reports > Fulfilment > Inventory Age to see exactly how long each SKU has sat in a fulfilment centre. Where it’s available, Manage Excess Inventory in Seller Central will flag candidates automatically, saving you the manual sort.
The calculation behind all of it is simple: days of supply equals current FBA units divided by average daily sales over the trailing 90 days. Amazon itself treats more than 90 days of forward supply as the common threshold for flagging stock as excess, so anything above that line deserves a second look, even before fees kick in.
- Flag anything crossing 180 days of supply as an active candidate for exit action.
- Escalate anything at 365+ days to “decide now” status. It’s very unlikely to sell through at full price.
- Check your sell-through rate alongside days of supply. A slow SKU with a healthy sell-through trend might just need time, not liquidation.
- Separate stranded inventory from genuine excess. A listing suppression or category mismatch can look identical to slow-moving stock, but the fix is often a reactivation, not a removal.
Pro Tip: Rank your candidate list by net margin per unit after FBA fees, referral fees and expected ad spend, not by unit count. Ten low-margin units tying up cash matter less than two high-margin SKUs stuck in storage.
Why unsold stock erodes your account and your profit
Storage fees are only the opening cost. Amazon layers an aged-inventory surcharge on top once stock crosses 181 days, and that surcharge increases again after 365 days — the exact mechanics are broken down in Osellpa’s guide to long-term storage fee timelines. Beyond the invoice, ageing stock drags down your Inventory Performance Index. A weak IPI score can shrink the FBA storage capacity Amazon allocates you, which blocks new shipments right when you need space for a fresh launch or a fast-moving bestseller.
There’s a quieter cost too. Capital sitting in unsold boxes isn’t funding your next order, and ad budget spent defending a slow SKU’s visibility is budget not spent on a listing that converts.
| Cost factor | 90 days | 180 days | 365+ days |
|---|---|---|---|
| Standard monthly storage | Applies | Applies | Applies |
| Aged-inventory surcharge | None | Begins | Increases further |
| IPI impact | Minimal | Moderate | Significant |
| Typical seller response | Monitor | Test price/promo | Liquidate or remove |
How to clear excess stock without losing your margin
Work through these steps in order. Each one costs more, in fees or in recovery percentage, than the one before it, so exhaust the cheap options first.
- Run a price or promotion test. Drop price toward net landed cost plus FBA fees, or launch a coupon, and hold it for seven to 30 days. This is usually the cheapest lever you have, and small temporary price cuts often move enough units to avoid removal altogether.
- Bundle or cross-sell. Pair the slow SKU with a fast-moving companion product. You move stock without paying outside liquidation fees, and the bundle can even lift average order value.
- Use Amazon’s own channels. Outlet, Warehouse Deals style used listings, and FBA Grade & Resell (where your catalogue is eligible) let Amazon absorb some of the merchandising work.
- Consider removal for off-Amazon resale. If the product still has decent retail value outside Amazon, model the removal fee against what you’d realistically get selling it through another channel before committing.
- Liquidate if nothing else has worked. Amazon’s liquidation programme typically returns a gross recovery of around 5 to 10% of average selling price before fees. That’s low, but it beats paying storage surcharges indefinitely on stock that isn’t moving.
- Dispose or donate what’s genuinely unsellable. Damaged or expired stock rarely justifies removal shipping costs. Donation is often the lowest-cost, cleanest exit, and it avoids landfill fees in some categories.
Pro Tip: Model liquidation as a margin decision, not a warehouse clean-up. Compare the net recovery after Amazon’s fees against another three to six months of storage and surcharges. The answer is often clearer than sellers expect.
Before you act, run through a short checklist: is this SKU still profitable per unit once fees are stripped out? How much storage exposure does it carry if you wait another 90 days? And does discounting it hard risk your brand’s pricing position elsewhere on the listing?
Stopping the next batch of overstock before it happens
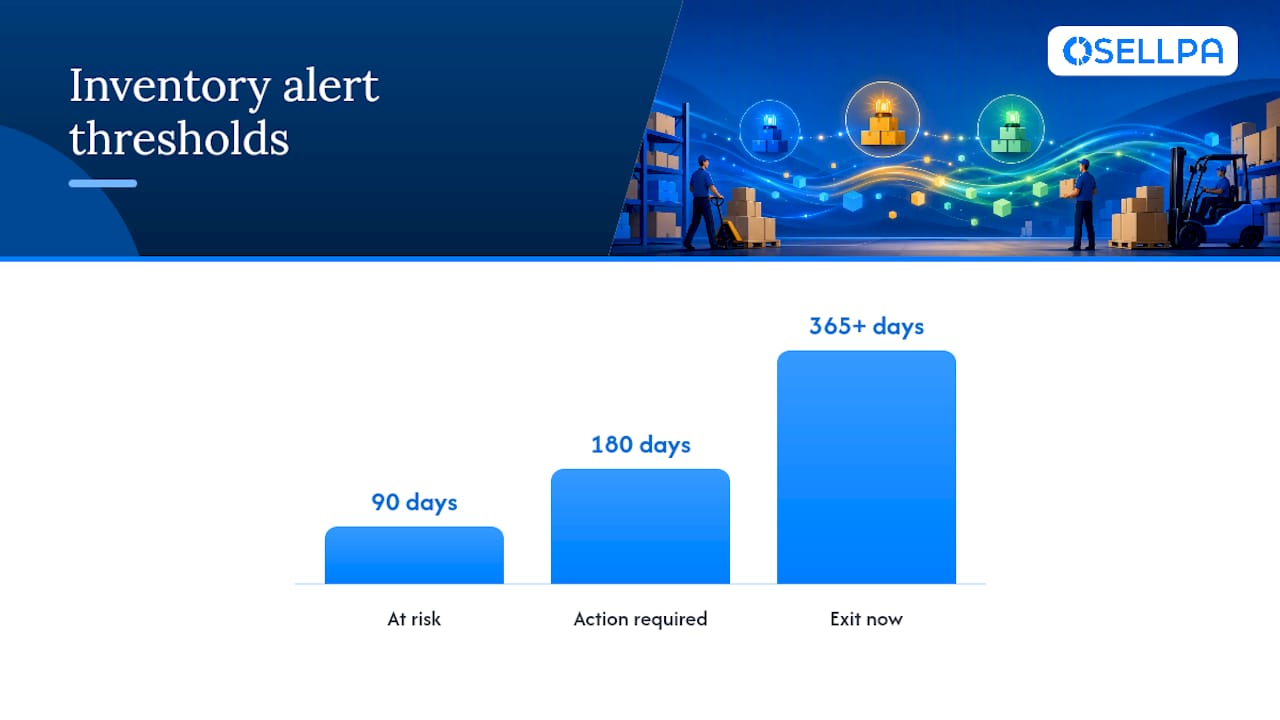
Prevention is a cadence problem, not a forecasting problem alone. Review your top 20 SKUs by revenue every week; everything else can wait for a monthly pass. Set alerts at 90 days (at risk), 180 days (action required) and 365+ days (exit now), and let the system nudge you rather than relying on memory.
Forecasting itself should lean on trailing-90-day velocity, adjusted for seasonality, and matched against your supplier’s actual lead time, not last year’s peak. That last point trips up more sellers than any other: reorder to current velocity, not historical highs. If a SKU was flying twelve months ago but has cooled, ordering the old volume guarantees a repeat of the same excess problem.
- Set reorder points using trailing-90 velocity plus lead-time buffer, not gut feel.
- Lower individual reorder quantities and increase ordering frequency to reduce the size of any single mistake.
- Build safety stock around your slowest reliable supplier lead time, not your fastest one.
- Use a sell-through rate benchmark to sanity-check whether a SKU’s velocity is genuinely recovering or just having a good week.
- Confirm your forecasting tool accounts for promotional spikes separately from organic demand, since AI-driven demand forecasting tends to improve accuracy specifically by separating those signals.
On the technology side, look for real-time inventory sync, automated reorder alerts, a sell-through dashboard, and profit-per-unit visibility in one place. Chasing this across five spreadsheets is exactly how SKUs slip past the 180-day mark unnoticed. Freeing up that tied-up capital also has a direct effect on how much working capital your business has for new stock or advertising, a point worth understanding properly through cash flow management fundamentals.
Automating the checks so nothing slips past 180 days
Manually cross-referencing Inventory Age reports against your P&L every week is exactly the kind of task that gets skipped when things get busy, and skipping it is how stock quietly crosses 365 days. An inventory health dashboard that pulls Amazon data automatically closes that gap.
Configure it properly and the routine becomes hands-off:
- Weekly automated monitoring of your top 20 SKUs by revenue, flagged the moment they slow down.
- An alert at 180 days that pushes the SKU into an “action required” list rather than waiting for you to remember to check.
- Profit-per-unit calculations that strip out FBA fees, referral fees and ad spend, so you’re prioritising by margin, not guesswork.
- Advertising optimisation that can be pointed specifically at slow-moving SKUs to test whether a visibility push clears stock before you resort to liquidation.
Pro Tip: Set your automated price-test trigger to fire the moment a SKU crosses 180 days, rather than waiting for the monthly review. A week’s head start on a promotion is often the difference between a clean sell-through and a liquidation write-off.
… If you want to see how this looks against your own catalogue, Osellpa’s inventory management tool runs the age and margin calculations automatically against your live Amazon data.
Rules for making the call without second-guessing yourself
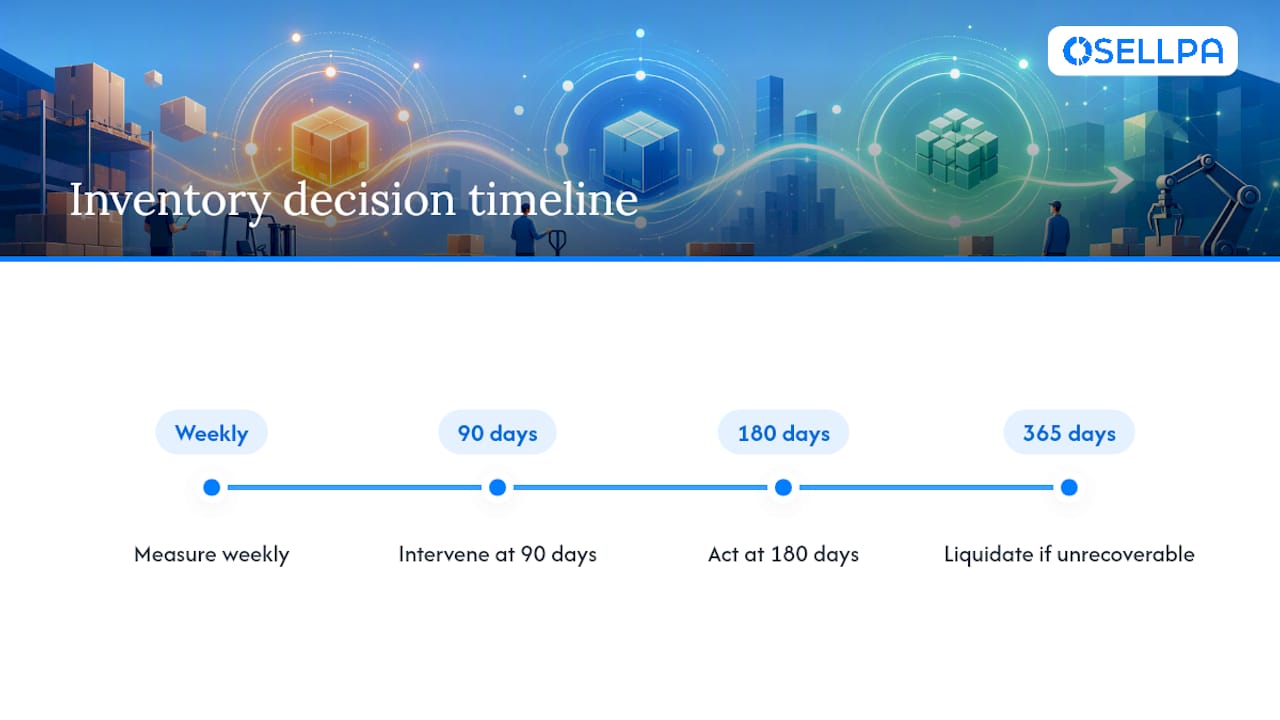
Most sellers don’t lose money on excess stock because they lack a spreadsheet. They lose money because they hesitate. My rule is blunt: measure weekly, act at 180 days, liquidate at 365 when there’s no realistic recovery path left. Sentiment is the enemy here. The SKU that “just needs one more push” is usually the one quietly costing you a storage surcharge every single month.
Align your inventory rules to cashflow, not to how much you originally paid for the stock. That number is sunk. The only question that matters now is what the unit is worth to you today, sitting where it is, against what it costs to keep it there.
— Harry
Turn this playbook into an automatic weekly routine
Running these checks by hand, every week, across every SKU, is where most sellers fall behind. Osellpa’s inventory tool combines profit tracking with automated excess alerts, so a SKU crossing 180 days shows up with its true margin already calculated, no spreadsheet required.
A short trial gets you three concrete wins immediately: your excess inventory report flagged and ranked by real profit exposure, automatic alerts set at the 90 and 180 day marks so nothing slips through, and a price test scheduled against your slowest SKUs without you touching a single listing manually. If advertising spend is part of what’s propping up a slow mover, the free PPC bid optimisation report shows you where that budget is actually going.
Start with the Amazon inventory management tool and see your current excess exposure within minutes of connecting your account.


