
ACoS measures campaign-level ad efficiency; TACoS measures how much of your entire Amazon business depends on advertising. Use ACoS to judge whether a specific campaign, keyword, or bid is profitable. Use TACoS to judge whether your business is building organic momentum or quietly becoming addicted to ad spend. You need both, but they answer different questions.
TL;DR:
- Monitoring TACoS over 90 days provides a better view of overall business growth than tracking individual campaign ACoS.
- Small brands often have higher TACoS targets and should focus on decreasing TACoS gradually rather than chasing short-term ACoS drops.
- Automated dashboards that synchronize ad spend, sales, and revenue help prevent calculation errors and reveal true business trends efficiently.
- A high ACoS can still coexist with a low TACoS if advertising efforts result in organic rank improvements and repeat sales.
- Both metrics serve different purposes: use ACoS for immediate campaign adjustments and TACoS for strategic, long-term growth assessment.
Table of Contents
- What is ACoS? The formula and a worked example
- What is TACoS? The formula and why it tells a different story
- ACoS vs TACoS: a practical comparison for decision-making
- Healthy benchmarks for ACoS and TACoS by product lifecycle
- How to measure TACoS and ACoS without fooling yourself
- Common mistakes sellers make with ACoS and TACoS
- How automation shortens the path from metric to profit
- The limits of TACoS as a performance metric
- Practical strategies to lower TACoS without starving growth
- When to prioritise ACoS over TACoS, and when to flip that order
- How TACoS captures what ACoS deliberately ignores
- The organic halo: how sponsored ads shape unpaid sales
- Author perspective: what I’d actually watch week to week
- Turn these metrics into automatic decisions with Osellpa
- Sources
What is ACoS? The formula and a worked example
ACoS stands for Advertising Cost of Sale, and the formula behind it is simple: ad spend divided by ad-attributed sales, multiplied by 100. It tells you how much you paid in advertising for every pound of sales that advertising directly generated. Nothing else counts. Organic sales, word-of-mouth, repeat customers browsing your storefront, none of it factors into ACoS.
Here’s the maths. Say you spend £200 on a Sponsored Products campaign in a week, and that campaign generates £1,000 in attributed sales. Divide 200 by 1,000, multiply by 100, and you get a 20% ACoS.
Whether that’s good depends entirely on your margin. That’s where break-even ACoS comes in:
- Break-even ACoS equals your gross margin percentage before advertising costs.
- If your product carries a 35% margin, you can technically spend up to 35% of sales on ads before that campaign stops paying for itself.
- Campaigns running above break-even ACoS are burning cash on every sale unless you’re deliberately buying visibility for a launch or a competitive keyword grab.
Knowing your break-even number turns ACoS from an abstract percentage into a bid decision you can act on the same day.
What is TACoS? The formula and why it tells a different story
TACoS, or Total Advertising Cost of Sale, uses a wider denominator: ad spend divided by total revenue, both paid and organic. This is the number that shows whether your advertising is actually growing the business, or just cycling the same spend into the same narrow slice of sales.
Take that same £200 weekly ad spend. If your total revenue that week, including everything sold outside of Sponsored Products, comes to £4,000, then TACoS is 200 divided by 4,000, times 100, which gives you 5%.
Compare that to the 20% ACoS from the earlier example. Same spend, wildly different reading, because the denominators aren’t measuring the same thing:
- ACoS only ever looks at sales the advertising itself claims credit for.
- TACoS looks at every sale on the listing, whether a shopper clicked an ad or found you through organic search.
- A high ACoS paired with a falling TACoS often means your ads are creating an “organic halo”: ranking improvements and repeat buyers that keep paying off long after the click.
- A low ACoS paired with a rising TACoS can mean you’re spending more in absolute terms even though each campaign looks efficient on paper.
ACoS vs TACoS: a practical comparison for decision-making
The two metrics disagree on purpose by design. ACoS is narrow and reacts fast, useful for the campaign manager adjusting bids this afternoon. TACoS is broad and moves slowly, useful for the business owner deciding whether the whole advertising strategy is working.
| Factor | ACoS | TACoS |
|---|---|---|
| Scope | Single campaign or keyword | Entire product or account |
| Denominator | Ad-attributed sales only | Total revenue (paid + organic) |
| Volatility | High, shifts daily with bids | Low, moves gradually over weeks |
| Best used for | Bid changes, keyword pruning | Budget strategy, launch planning, board reporting |
Mapping metrics to actions keeps teams from talking past each other:
- Bid adjustments and negative keywords: read ACoS at the campaign or search-term level.
- Deciding whether to increase overall ad budget: read TACoS trend over 90 days.
- Judging a new product launch: expect both to run high temporarily, then watch TACoS fall as organic rank builds.
- Reporting to finance: TACoS ties cleanest to overall profitability and cash flow.
- Briefing a PPC manager or agency: ACoS is the number they should be optimising campaign by campaign.
Healthy benchmarks for ACoS and TACoS by product lifecycle
Benchmarks only mean something when you attach them to a stage of the product’s life. A brand-new listing chasing its first reviews needs a completely different target than a five-year-old bestseller.
- Launch phase: ACoS often runs 30 to 50%, and TACoS typically sits in the 25 to 35% range, because you’re paying a premium to build rank and reviews from zero.
- Growth phase: ACoS should be trending down towards your break-even figure as keywords mature, while TACoS gradually eases as organic sales pick up the slack.
- Mature phase: TACoS in the 5 to 15% range is common for established products with a strong organic rank, though this varies by category and margin.
Smaller brands tend to run these benchmarks hotter for longer. Smaller brands typically spend a larger proportion of revenue on Amazon ads than large, established brands, simply because they lack the organic visibility bigger competitors have already banked. If you’re a smaller seller, don’t panic when your TACoS sits above a “mature” benchmark; panic if it isn’t trending downward over time. A falling TACoS alongside stable or rising revenue is the healthiest pattern in Amazon advertising. A rising TACoS with flat revenue is the clearest early warning sign you have.
How to measure TACoS and ACoS without fooling yourself
Amazon doesn’t hand you a TACoS number anywhere in Seller Central. You have to build it, and that means pulling from two separate places: the Advertising Console for ad spend and ad-attributed sales, and Business Reports for total revenue. Miss this step and you’ll end up comparing figures from mismatched date ranges, which produces a TACoS number that means nothing.
- Pull ad spend and ad sales from the Advertising Console for your chosen window.
- Pull total ordered product sales for the same exact date range from Business Reports.
- Divide spend by total sales to get TACoS, and repeat this weekly so you’re building a trendline, not a single data point.
- Run the same exercise across 7-day, 30-day, and 90-day windows. Short windows catch sudden problems; the 90-day window shows the real direction.
- Remember Amazon’s attribution model credits the last click, which understates the influence ads have further up the funnel, so treat both metrics as directional rather than exact.
Pro Tip: Never judge a single week’s ACoS or TACoS in isolation. A weekend promotion, a stockout, or a competitor’s price cut can swing either number by ten points overnight. Look at the 90-day trendline before you touch a single bid.
Common mistakes sellers make with ACoS and TACoS
Most of the damage happens quietly, one small decision at a time, rather than through a single dramatic error.
- Chasing a lower ACoS by cutting “expensive” keywords. Discovery keywords that carry a higher ACoS often drive the organic rank gains that lower your TACoS months later; killing them saves money today and costs you rank tomorrow.
- Judging performance from one month’s numbers. A single month catches seasonality, not strategy. Build the habit of reading 90-day trends instead of month-to-month snapshots.
- Setting targets without checking margin, returns, or lifetime value. A 20% ACoS is excellent on a product with 50% margin and terrible on one with 15% margin and a high return rate.
How automation shortens the path from metric to profit
Building TACoS by hand, joining spreadsheets from two different Amazon reports, matching date ranges, correcting for last-click attribution quirks, eats hours every week and still leaves room for error. One mismatched date range and your whole trendline is wrong.
Dashboards that pull ad spend, ad-attributed sales, and total revenue into one automated feed remove that manual joining step entirely. A portfolio view that tracks TACoS trending against cohort splits (new products versus mature ones) catches a warning sign days sooner than a monthly spreadsheet review would.
- Automated syncing eliminates the date-range mismatches that quietly corrupt manual TACoS calculations.
- Portfolio-level dashboards separate launch-stage products from mature ones automatically, so benchmarks stay relevant.
- Osellpa’s direct Amazon API integration keeps ad spend and total revenue figures in sync without manual exports, and sellers using its PPC optimisation tools have reported sales increases of up to 20%.
The limits of TACoS as a performance metric
TACoS is the better strategic compass, but it isn’t a complete instrument on its own, and treating it that way causes its own set of blind spots.
TACoS blends every advertising type, Sponsored Products, Sponsored Brands, Sponsored Display, into a single number. A campaign draining budget with nothing to show for it can hide behind a healthy overall TACoS if other campaigns or strong organic sales are carrying the average. You need ACoS at the campaign level to catch that.
TACoS also reacts to forces that have nothing to do with your advertising skill. A seasonal spike in organic demand, a competitor going out of stock, or a viral mention outside Amazon can push TACoS down and make your ad strategy look better than it actually is. The reverse is equally true: a slow organic month can make TACoS climb even when your campaigns are performing exactly as they should.
It also lags. Because TACoS blends paid and organic sales over time it takes weeks to reflect a genuine shift in ad strategy. A seller who cuts wasteful spend today won’t see it clearly in TACoS for a month or more, which makes it a poor tool for daily decisions.
Finally, TACoS says nothing about profit margin directly. A product with 5% TACoS and thin margins can be less healthy than one with 15% TACoS and strong margins. Pair TACoS with a genuine profit and loss view, not just revenue, before drawing conclusions about business health.
Practical strategies to lower TACoS without starving growth
Improving TACoS isn’t about slashing ad spend, it’s about making organic sales carry more of the weight over time, so advertising becomes a smaller share of a bigger pie.
Start with search-term and listing quality. Ads that convert well feed Amazon’s organic ranking algorithm, which means better images, tighter bullet points, and stronger backend keywords lift both paid and organic performance simultaneously. This is one of the few levers that improves ACoS and TACoS in the same motion.
Shift budget towards keywords already ranking on page one organically to defend that position, rather than only chasing new, expensive keywords where you have no organic footing yet. Defending existing rank is usually cheaper than winning new rank from scratch.
Layer in review generation and post-purchase follow-up. More reviews improve conversion rate across both paid and organic traffic, which lowers the ad spend needed to hit the same revenue target.
Watch for diminishing returns on individual campaigns and reallocate that budget towards top-of-search placements on your best-selling ASINs, where the ad dollar reliably lifts both immediate sales and long-term organic visibility. Reducing wasted spend on irrelevant search terms through regular negative-keyword hygiene frees up budget for the keywords actually doing the work, which compounds into a lower TACoS over successive months rather than a single dramatic drop.
When to prioritise ACoS over TACoS, and when to flip that order
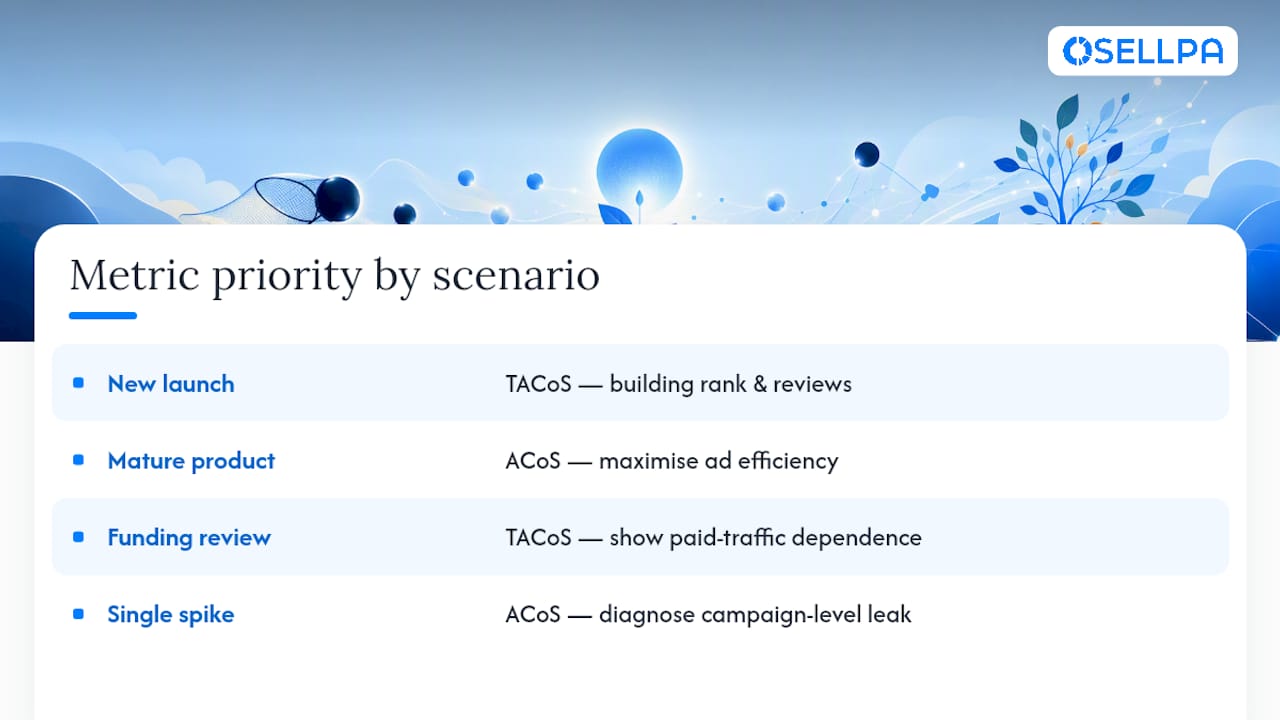
Scenario one: a brand-new launch in a competitive category. ACoS will run high, sometimes dramatically so, and that’s expected. Here, TACoS matters more, because you’re deliberately buying rank and reviews. Watching ACoS too closely at this stage leads to premature bid cuts that stall the very momentum you’re paying for.
Scenario two: an established, profitable core product. ACoS becomes the priority here. The product already has organic rank and repeat buyers; your job is squeezing maximum efficiency from every ad pound rather than building anything new. A creeping ACoS on a mature product, with no strategic reason behind it, is a leak worth plugging fast.
Scenario three: a portfolio review ahead of a funding or acquisition conversation. TACoS takes priority, because outside stakeholders care about how dependent the business is on paid traffic, not the granular performance of any one campaign.
Scenario four: a sudden ACoS spike on one campaign inside an otherwise healthy account. Diagnose at the ACoS level first. TACoS won’t move enough to flag the problem quickly if the rest of the portfolio is stable, so campaign-level ACoS is your early-warning system here.
The pattern across all four: TACoS answers “is the business healthy,” ACoS answers “is this specific decision working.” Use the wrong one for the question in front of you and you’ll either overreact to normal launch noise or miss a genuine leak hiding inside a healthy-looking average.
How TACoS captures what ACoS deliberately ignores
The entire disagreement between these two metrics comes down to one design choice: what counts as revenue in the denominator.
ACoS was built to answer a narrow question: is this ad spend paying for itself, click by click. It deliberately excludes organic sales because campaign managers need a clean, isolated view of ad performance to make bidding decisions. Mixing in organic sales would make it impossible to tell whether a specific keyword is working.
TACoS was built to answer the opposite question: is advertising, taken as a whole, moving the business forward. By including every sale, paid and organic, TACoS captures something ACoS structurally cannot see: the compounding effect of advertising on organic rank, review velocity, and repeat purchase behaviour. A seller who only ever watches ACoS can run a “profitable” account by every campaign-level measure while the business itself stagnates, because the ad spend never converts into lasting organic strength.
This is precisely why sellers debate which metric matters more in the first place. Forum threads on the subject show real confusion, sellers reasonably asking whether to chase a tight ACoS or accept a higher one for the sake of a healthier TACoS trend, particularly around launch timing. The honest answer is that both readings are correct at once. ACoS tells you the ad is efficient today. TACoS tells you whether that efficiency is actually building something durable.
The organic halo: how sponsored ads shape unpaid sales
Sponsored ads don’t just generate the sales Amazon attributes to them directly. A shopper who clicks a sponsored listing, doesn’t buy that day, then searches the brand name a week later and purchases organically, never shows up in ACoS. That sale only appears in TACoS, folded into total revenue with no ad spend credited against it in the visible attribution.
This is the organic halo effect, and it’s the single biggest reason TACoS and ACoS can tell contradictory stories about the same campaign. A keyword with a punishing 45% ACoS might be the exact keyword driving enough repeat search volume and organic rank improvement to pull the product’s overall TACoS down over the following quarter. Cut that keyword because the ACoS looks bad in isolation, and you cut off the halo effect along with it.

The relationship runs in both directions, though. Pulling back ad spend too aggressively on a product still building organic rank can stall that momentum before it compounds, leaving both metrics worse off: ACoS unchanged on the campaigns that remain, and TACoS creeping upward as total revenue growth stalls without the ad-driven visibility that was building it. This is why a rising TACoS immediately after a spend cut isn’t automatically a red flag. It can simply mean the halo hasn’t caught up yet.
Watching how TACoS moves in the weeks after a deliberate ACoS-driven decision, rather than the days after, is the only reliable way to see the halo effect play out rather than mistake short-term noise for a genuine trend.
Author perspective: what I’d actually watch week to week
Treat TACoS as your headline number and ACoS as your diagnostic tool. Check ACoS weekly at the campaign level to catch waste early. Review TACoS monthly against a 90-day trendline, not a single snapshot, before making any strategic call. If TACoS is falling while revenue holds steady, your advertising is doing its job even if individual campaigns look expensive.
— Harry
Turn these metrics into automatic decisions with Osellpa
Manually joining Advertising Console exports with Business Reports every week, checking date ranges match, recalculating TACoS by hand, is exactly the kind of task that eats an afternoon and still leaves room for a spreadsheet error. Osellpa connects directly to Amazon’s API to pull ad spend, ad-attributed sales, and total revenue into one dashboard, so your TACoS and ACoS trendlines update automatically instead of waiting for your next spreadsheet session.
The performance dashboard tracks portfolio-level TACoS alongside campaign-level ACoS, split by product lifecycle so a launch isn’t judged against mature-product benchmarks. Pair that with automated PPC bid adjustments through the advertising reports and full profit tracking, so you’re weighing ad efficiency against actual margin, not just revenue. If you want a low-effort first look at where your current campaigns stand, start with a free Amazon PPC bid optimisation report and see exactly which keywords are helping your TACoS and which ones are quietly working against it.


