
The Search Term Report is a downloadable CSV showing exactly which customer queries triggered a click on your Sponsored Products or Sponsored Brands ads. Download the last 30 days from the Amazon Ads console right now, and set aside 30 to 45 minutes each week to mine it. That single habit, backed by Amazon’s own reporting guidance, is what separates accounts that bleed ad spend from ones that compound profit every month. Some sellers who act on this data report seeing measurable sales gains within weeks.
TL;DR:
- Filtering for search terms with at least 10 clicks and a spend of over £5 to £10 ensures decisions are based on statistically significant data.
- Regular weekly reviews should focus on the top 20 to 30 high-spend search terms to identify winners, drains, and irrelevant queries for immediate action.
- Automated tools and scheduled report pulls are recommended for managing multiple campaigns and ASINs efficiently, saving hours in manual analysis.
- Cross-referencing search term data with campaign and placement reports reveals structural issues like cannibalization and placement inefficiencies.
- Extending data review to 60 or 90 days helps identify genuine trends versus seasonal shifts, preventing misjudgment of search term performance.
Table of Contents
- What is a search term report on Amazon?
- How do you download and schedule the report?
- What do the report columns actually mean?
- The weekly workflow that actually moves the needle
- Turning report data into negatives, exact-match harvests and bid moves
- Feeding search term data back into your listing copy
- Mistakes that turn good data into bad decisions
- Manual review or automation: where the line sits
- Why seasonality changes how you read the numbers
- Connecting search term data to campaign and placement reports
- What before-and-after PPC improvement actually looks like
- My one-hour weekly routine
- Let Osellpa handle the repetitive parts of this routine
- Sources
What is a search term report on Amazon?
The report covers two campaign types: Sponsored Products and Sponsored Brands. It shows only queries that generated clicks, according to Amazon’s official documentation. That distinction matters when you’re deciding whether a term with zero clicks is worth negating. It isn’t showing up in this report at all, so you’d need the search term impression share or placement data elsewhere to catch it.
You’ll find the report inside the Amazon Ads console, not buried in Seller Central’s older reporting tools (though a version is also accessible there for sellers who manage ads through Seller Central directly). The path is straightforward:
- Go to Reports in the left-hand navigation
- Select Create report
- Choose Sponsored Products or Sponsored Brands as the report type
- Pick Search term from the report subtype dropdown
- Set your date range and click Run report
Exports come as CSV files, and you can schedule them to generate automatically on a recurring basis rather than pulling them manually each time, a point Amazon’s reporting overview confirms applies across most Sponsored Ads report types. That scheduling option is worth setting up before you forget it exists.
How do you download and schedule the report?
Getting a clean, usable file takes minutes once you know the sequence. Follow these steps in the Ads console:
- Log into your Amazon Ads console and navigate to Reports.
- Click Create report, then select the ad type (Sponsored Products first, Sponsored Brands second if you run both).
- Choose Search term as the report type.
- Set the date range. For your weekly routine, use a rolling 30-day window; for a quarterly strategic review, extend it to 60 to 90 days, as practitioner guidance recommends to avoid noisy short-window data.
- Run the report and download the CSV once it’s ready.
- Rename the file with a consistent convention, something like
STR_[ASIN or brand]_[date range], and store it in a dated folder so you can compare week over week. - If you want recurring delivery, use the scheduling option in the console to generate the same report automatically every week.
Doing this once by hand teaches you the interface. Doing it every week by hand is where most sellers quietly give up, which is exactly the gap automation exists to close.
Pro Tip: Keep last week’s CSV open in a second tab while you review the new one. Spotting which terms moved from “watching” to “winning” in seven days is far easier side by side than from memory.
What do the report columns actually mean?
Twelve or so columns show up in every export, but five of them drive nearly every decision you’ll make. Here’s what each one tells you:
- Customer search term: the exact phrase a shopper typed before clicking your ad.
- Impressions: how many times your ad appeared for that term.
- Clicks: how many of those impressions turned into a click.
- Spend: total ad cost attributed to that search term.
- Orders: units purchased after a click on that term.
- Sales: total revenue attributed to that term.
- ACoS: advertising cost of sale, spend divided by sales, expressed as a percentage.
- ROAS: return on ad spend, the inverse relationship to ACoS.
- Conversion rate: orders divided by clicks.
- Match type: whether the triggering keyword was broad, phrase, or exact.
- Targeting: the specific keyword or product target that matched the query.
- Campaign / Ad group: which campaign structure the spend sits under.
Of these, Customer search term, Spend, Orders, Sales, and ACoS do the heavy lifting. Calculating per-term ACoS is simple: divide that row’s Spend by its Sales. A term with £40 spend and £100 sales sits at 40% ACoS.
Here’s where a lot of sellers trip up: background analysis on report thresholds suggests filtering for at least 10 clicks before making a bidding decision on any single term. Fewer than that, and you’re reacting to statistical noise, not a real pattern.
ACoS percentage also isn’t the whole story. A term at 45% ACoS on a £2 item might lose you money outright, while the same 45% on a £60 item with healthy margin could still be profitable in absolute pounds. Always cross-check ACoS against your actual product cost and margin before pulling the trigger on a bid change.
The weekly workflow that actually moves the needle
This is the routine. Block around half an hour each week, same day, and run through the workflow in order.
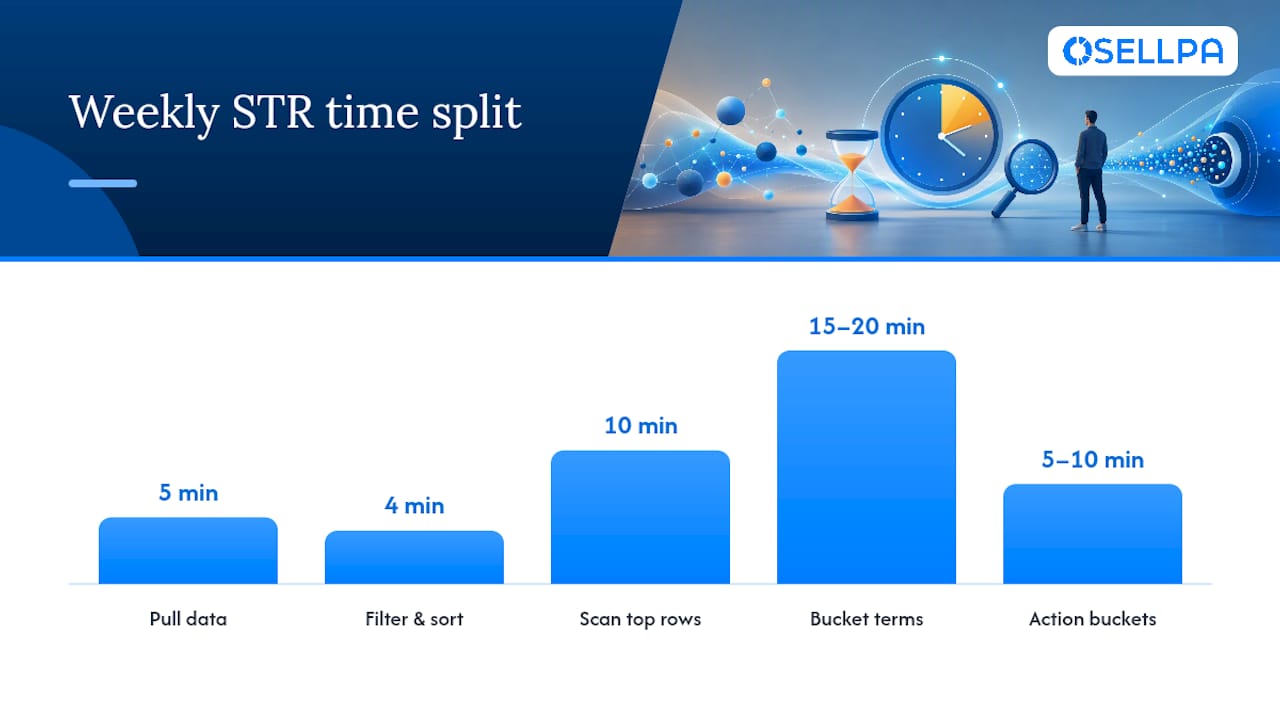
- Pull the last 30 days of Sponsored Products and Sponsored Brands search term data (5 minutes).
- Filter for Spend greater than £0. Anything with zero spend didn’t cost you money, so it waits (2 minutes).
- Sort by Spend, descending. Your biggest cost centres sit at the top, and that’s where the most value hides (2 minutes).
- Scan the top 20 to 30 rows for Orders. Zero orders next to meaningful spend is your first red flag (10 minutes).
- Bucket every reviewed term into one of four categories (15 to 20 minutes).
- Action each bucket before you close the file (5 to 10 minutes).
The four buckets, and what to do with each:
- Winners: consistent conversions, ACoS at or below your target. Action: promote to a dedicated exact-match campaign and consider a bid increase.
- Potentials: some clicks, one or two conversions, ACoS slightly above target. Action: leave running, watch next week, don’t touch bids yet.
- Money drains: meaningful spend, zero or near-zero conversions over enough clicks to be meaningful. Action: add as a negative keyword.
- Irrelevant: the term has nothing to do with your product despite triggering a click. Action: negate immediately regardless of spend, since it will only get worse.
Weekly reviews catch the small leaks before they become a monthly haemorrhage. A monthly deep review, layered on top of the weekly habit, is where you check for structural issues: campaign cannibalisation, stale bids, or a whole ad group that’s underperforming across the board. Operator write-ups on this workflow describe exactly this bucketed approach as the difference between accounts that improve steadily and ones that stagnate.
Pro Tip: Set a recurring calendar reminder titled “STR mining, 30 minutes” rather than relying on memory. The sellers who skip this most often are the ones who never blocked the time in the first place.
Quarterly, extend your lookback to 60 or 90 days and ask a bigger question: is your overall keyword strategy still matching how customers actually search for this product, or has the market shifted underneath you?
Turning report data into negatives, exact-match harvests and bid moves
Three typical actions per weekly session: add negatives, harvest winners, adjust bids. Get the mechanics right and you avoid the two most common self-inflicted wounds: negating too early and cannibalising your own campaigns.
For negative keywords, filter for terms with spend above a level that matters to your account (start around £5 to £10 for smaller accounts, higher for larger ones) and zero conversions. Add these as negative exact if the term itself is close to relevant but not quite right, or negative phrase if an entire pattern of irrelevant queries is triggering.
For harvesting, the threshold that experienced operators use is consistency: a term needs multiple conversion events within your lookback window, not a single lucky sale, and an ACoS at or below target before it earns a spot in a dedicated exact-match campaign. Practical guidance from BrandGrowthIQ’s operator research recommends keeping this harvest campaign entirely separate from your discovery campaigns, that structure is what prevents cannibalisation.
Cannibalisation happens when your new exact-match campaign and your original broad or phrase campaign both bid on the same term, competing against yourself and driving your own costs up. The fix is straightforward: once a term graduates to exact match, add it as a negative exact inside the original campaign so it stops triggering there.
Bigger jumps look decisive but usually just introduce more noise into next week’s report. Reviewing the PPC optimisation side of this alongside search term data helps you see whether a bid change actually shifted position or just spend.
Feeding search term data back into your listing copy
The best search term data doesn’t stay in your ads account. If a phrase converts well through PPC but isn’t already in your title, bullets, or backend keywords, you’re paying to prove organic demand you haven’t captured yet.
Prioritise phrases that are both high-converting and high-volume; a term with three conversions and thousands of impressions deserves a spot in your listing before a term with one conversion and fifty impressions. Once you’ve made a change, treat it like a test rather than a one-off edit, watch organic rank and conversion rate over the following weeks to confirm the phrase is pulling its weight.
A few practical notes on where these phrases go:
- Title and bullets get the highest-intent, highest-converting phrases, written in natural language rather than a keyword list.
- Backend search terms absorb secondary variations, synonyms, and phrasing you don’t want cluttering customer-facing copy.
- Keep your brand’s tone and readability intact. A title stuffed with every converting phrase reads badly and can hurt conversion even as it helps discoverability.
This is where paid and organic performance start reinforcing each other. Guidance on turning search query performance data into listing action and on product page optimisation from Medway Web Design both point to the same principle: what customers actually type is a better source of listing language than any guess about what they might type.
Mistakes that turn good data into bad decisions
A seven-day window is rarely enough to justify a bid or negative decision. Small sample sizes exaggerate both good and bad performance, a term that converted twice in three clicks looks brilliant but tells you almost nothing statistically.
A few thresholds worth holding yourself to:
- Wait for at least 10 clicks on a term before adjusting its bid, and preferably closer to 20 for a permanent negative.
- Don’t judge a new campaign or harvested term inside its first full week; give it time to accumulate real signal.
- Treat a single conversion as encouraging, not confirming, unless the term also carries meaningful click volume.
- Cross-check ACoS against absolute margin every time, a low percentage on a low-margin item can still lose money.
Guidance on lookback windows is consistent on this point: a 30-day rolling window smooths out day-to-day noise for routine decisions, while 60 to 90 days is where genuine strategic patterns become visible.
Manual review or automation: where the line sits
Manual mining works well for small catalogues, a handful of SKUs, low daily spend, and enough time to check every row yourself. Once you’re managing multiple ASINs, several campaigns each, and spend that adds up daily, the same 30 to 45 minute session starts eating hours instead.
That’s the point where rule-based automation earns its place. Scheduled report pulls, automatic negative additions once a term crosses your spend and zero-conversion threshold, and profit-aware bid adjustments replace the repetitive parts of the routine without removing your judgement from the strategic calls.
Osellpa’s keyword tracker and PPC tools connect directly to Amazon’s API to handle exactly this kind of recurring work, scheduled search term pulls, rule-based negative keyword suggestions, and bid optimisation reports that flag which terms deserve attention before you’ve even opened the CSV.
- Scheduled reports remove the “did I remember to pull this” problem entirely.
- Rule-based negatives catch obvious money drains between your weekly sessions, not just during them.
- Profit-aware bid logic weighs margin alongside ACoS, avoiding the trap of chasing a low percentage on a thin-margin product.
Pro Tip: If you’re spending more time exporting and renaming CSV files than actually reading them, that’s the signal it’s time to automate the pull, not the decision-making.
Why seasonality changes how you read the numbers
A search term’s performance in December tells you very little about how it will perform in March. Holiday shopping periods, back-to-school windows, and category-specific peaks (garden furniture in spring, fitness equipment in January) all shift both search volume and conversion rate for reasons that have nothing to do with your bid strategy.
This matters most when you’re comparing week-over-week data across a seasonal boundary. A term that looked like a money drain in the slow weeks before Black Friday might convert perfectly well once demand actually arrives, and a term that performed brilliantly during a peak period can look like it’s suddenly failing once that peak passes. Neither shift is a signal that your targeting broke.
The practical fix is to compare like periods rather than adjacent ones. Look at this November against last November, not this November against October. If you don’t have a full year of data yet, at least flag known seasonal categories in your own notes so you don’t negate a genuinely good term just because it went quiet in a predictably slow month.
Market trends outside the seasonal calendar matter too. A competitor’s price drop, a new entrant in your category, or a shift in how Amazon’s algorithm weights certain queries can all move your search term numbers without any change on your end. Before you act on a sudden ACoS spike or conversion drop, check whether something changed in the broader category, not just in your own account.
Connecting search term data to campaign and placement reports
The Search Term Report answers “which queries are working,” but it doesn’t tell you the whole story on its own. Pair it with your campaign performance report to see whether a winning search term’s success is concentrated in one campaign or spread thinly across several competing ones, a pattern that often points to the cannibalisation problem covered earlier.
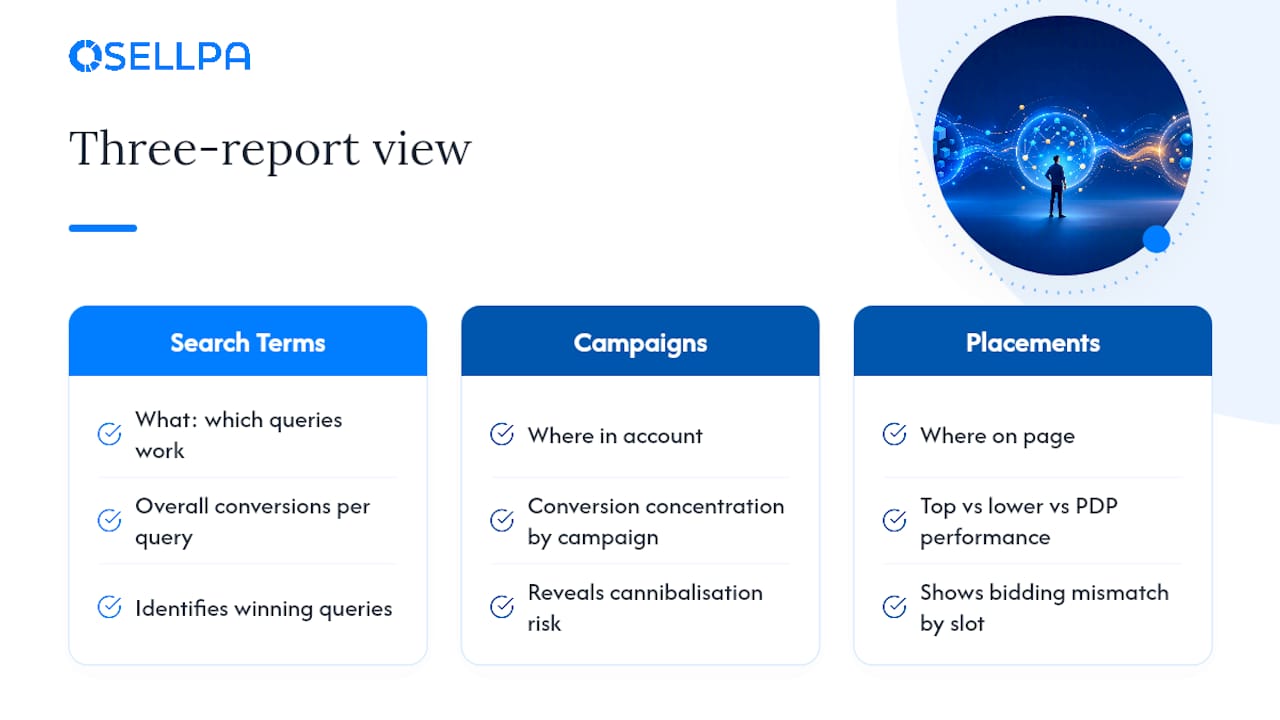
The placement report adds another layer entirely. A search term might convert well overall while performing very differently depending on whether the ad showed at the top of search results, further down the page, or on a product detail page. If your top-of-search placements are driving most of the conversions for a term but you’re bidding the same across all placements, you’re likely underbidding where it matters and overpaying where it doesn’t.
A holistic weekly or monthly review pulls all three reports side by side: search term data for the “what,” campaign performance for the “where in my account,” and placement data for the “where on the page.” Sellers who only ever look at the search term CSV in isolation tend to miss structural problems, like two campaigns quietly bidding against each other, that only become visible once you cross-reference. Building this three-report habit into your monthly deep review, on top of the weekly search term session, catches issues the weekly routine alone won’t surface.
What before-and-after PPC improvement actually looks like
The pattern that shows up consistently across sellers who commit to weekly search term mining is compounding improvement rather than a single dramatic jump. ACoS doesn’t usually fall off a cliff in week one, it drifts down gradually as negatives accumulate and harvested exact-match terms take over spend that used to go to broad match guesswork.
A typical trajectory looks like this: in the first two to three weeks, most of the work is defensive, adding negatives for obviously irrelevant terms that have been quietly draining budget for months. ACoS often improves noticeably here simply because wasted spend stops. By weeks four to eight, the harvesting side kicks in, converting search terms move into dedicated exact-match campaigns where you can bid more confidently, and overall conversion rate typically climbs because spend is now concentrated on proven language rather than spread across untested broad match variations.
By the two to three month mark, sellers who’ve kept the routine going tend to see a more efficient account structure overall, fewer overlapping campaigns competing against each other, cleaner negative keyword lists, and bid levels that reflect actual term performance rather than initial guesses.
The lesson from watching accounts improve this way isn’t that one big change fixes PPC. It’s that the weekly habit, repeated without skipping weeks, is what turns a mediocre account into an efficient one.
My one-hour weekly routine
Ten minutes: pull the report, filter for spend, sort. Twenty-five minutes: review the top 20 spenders line by line, bucketing each as I go. Fifteen minutes: add negatives and push winners into the harvest campaign. Ten minutes: write down what changed, so next week’s comparison actually means something.
I ignore anything under five clicks entirely; it’s not signal, it’s noise dressed up as data.
— Harry
Let Osellpa handle the repetitive parts of this routine
Everything covered here, the weekly pull, the bucketing, the negative additions, the exact-match harvesting, works by hand for sellers running a handful of campaigns. Once you’re managing several ASINs with daily spend that adds up fast, the manual version of this routine starts costing you more in hours than it saves in ad efficiency. Some software tools connect directly to Amazon’s API to pull scheduled search term data automatically, flag money drains before they compound, and suggest bid moves based on actual profit, not just ACoS percentage.
If you’re still under an hour a week on manual mining and it feels manageable, stay manual, there’s no need to automate a process that isn’t broken yet. But once that hour starts slipping or your catalogue grows past what you can review line by line, it’s worth seeing what Osellpa’s PPC optimisation tools can take off your plate. Start with a look at your account through the free PPC bid optimisation report to see exactly where your current spend is leaking before you decide what to automate first.


