
Accurate inventory forecasting on Amazon means predicting demand closely enough that you never run out of stock, never overpay for storage, and keep your Inventory Performance Index healthy. The immediate fix, if you haven’t done this in the last month: export 90 days of sales history, measure your real lead times from past purchase orders, and calculate a reorder point for every FNSKU you sell. Everything else in this guide builds from those three actions.
TL;DR:
- Tracking actual lead times and weekly velocity data ensures more accurate reorder points and prevents both stockouts and excess inventory.
- Using sales data at the FNSKU level and regularly recalculating reorder points reduces overstocking of slow-moving variations and stockouts of fast sellers.
- External disruptions require a rapid response with prioritized SKUs and predefined emergency plans, rather than relying solely on historical forecasts.
- Amazon’s tools are useful for basic demand planning, but advanced machine learning models and third-party software offer better accuracy for multi-channel and profit-focused inventory management.
- Maintaining disciplined weekly forecasting routines and updating lead times from recent purchase orders significantly improves inventory control and IPI scores.
Table of Contents
- What inventory forecasting means for Amazon sellers
- Which metrics actually predict Amazon inventory problems?
- How do you build a weekly inventory forecast?
- How do you calculate reorder point and safety stock?
- When do Amazon’s own tools stop being enough?
- Why do most Amazon forecasts fail in practice?
- The publisher’s view: closing the loop between forecast and profit
- How does forecasting fit into procurement and supply chain planning?
- How should you adjust forecasts when demand or supply breaks pattern?
- What does successful forecasting actually look like in practice?
- Weekly habits that keep forecasts honest
- Let Osellpa turn your forecast into a reorder plan
- Sources
What inventory forecasting means for Amazon sellers
Inventory forecasting for FBA sellers is the process of predicting how much stock you’ll sell over a given period, then deciding when and how much to send into Amazon’s network, whether that’s standard FBA, Amazon Warehousing and Distribution, or your own overflow storage. Get it wrong in either direction and Seller Central notices. Amazon’s FBA Inventory tool tracks how well you’re managing stock levels and feeds that data straight into your IPI score, which then determines your storage limits and fees.
Forecast too conservatively and you’ll face:
- Stockouts that kill your Buy Box eligibility and organic ranking
- Lost velocity that takes weeks to rebuild once you’re back in stock
- Restock limits tightening further because low sell-through signals poor planning
Forecast too aggressively and you’ll face aged-inventory surcharges, blown storage budgets, and cash tied up in stock that isn’t moving. Both failure modes come from the same root cause: treating forecasting as a one-off spreadsheet task rather than a weekly discipline.
Which metrics actually predict Amazon inventory problems?
You can’t forecast what you don’t measure. Four numbers matter more than the rest, and most sellers only track one of them.
IPI score. Amazon’s Inventory Performance Index blends your sell-through rate, stranded inventory levels, excess inventory percentage, and in-stock rate into a single figure. Drop below Amazon’s threshold and your storage limits shrink, sometimes overnight.
Daily velocity. Your rolling average units sold per day, ideally calculated on a 30, 60 and 90 day basis so you can spot whether demand is accelerating or fading.
Sell-through rate. Units sold against units held in FBA over a set period. A falling sell-through rate alongside stable velocity usually means you’ve overstocked, not that demand has dropped.
Days of supply (DOS). How many days your current stock will last at current velocity. This is the number that should trigger every reorder decision.
- IPI score: pulls from sell-through, excess stock, in-stock rate
- Daily velocity: track at 30/60/90 day windows
- Sell-through rate: falling rate often signals overstock, not weak demand
- DOS: the trigger metric for reorder timing
Pro Tip: Since 2026 fee changes moved the aged-inventory surcharge threshold earlier and calculate low-inventory fees per FNSKU, you need DOS and sell-through tracked at variation level, not just parent ASIN level. A healthy DOS on the parent can hide a starving FNSKU underneath it.
How do you build a weekly inventory forecast?
Run this process every week, not once a quarter. Forecasting decays fast when it’s treated as a set-and-forget task.
- Pull 90 days of data. Export sales, returns, promotions run, and any open purchase orders. Ninety days gives you enough signal to see trend without overreacting to a single good or bad week.
- Adjust for seasonality and promotions. A flat average misleads you the moment a lightning deal or a seasonal spike enters the picture. Using a weighted moving average that gives more weight to recent weeks, while still smoothing out one-off spikes, works better for daily operations than a simple average.
- Measure your real lead time. Don’t use the figure your factory quoted you. Average the actual number of days from PO placement to sellable receipt at FBA across your last three to five orders. This almost always runs longer than the quote once freight, customs clearance, and FC receiving delays are factored in.
- Set your reorder point and check open POs. Once you know velocity and true lead time, calculate the point at which a new order needs to go in, then check whether an open PO already covers that timeline.
- Review weekly. Velocity shifts, lead times drift, and promotions land. A weekly cadence catches problems while there’s still time to act.
Pro Tip: Build a simple operational rhythm rather than reinventing this each week: weekly velocity refresh, weekly reorder trigger check, monthly lead-time audit, quarterly SKU-level demand review. That cadence keeps forecasts tethered to what’s actually happening on the ground rather than what a spreadsheet assumed three months ago.
How do you calculate reorder point and safety stock?
The core formula is simple: Reorder Point = (Daily Velocity × Lead Time in Days) + Safety Stock.
Safety stock exists to absorb the gap between your forecast and reality, whether that’s a supplier delay, a surprise spike, or a shipping hold. As a default for 2026, most sellers should carry 30 to 45 days of safety stock, weighted toward the higher end for SKUs with volatile demand or unreliable suppliers, and toward the lower end where lead times are short and predictable. Carrying more than that routinely trips the tightened aged-inventory surcharge thresholds without meaningfully cutting stockout risk.
Take a worked example. A parent SKU sells 20 units a day, with a measured lead time of 35 days and 30 days of safety stock:
- Reorder point = (20 × 35) + (20 × 30) = 700 + 600 = 1,300 units
Now the same product has a slow-moving colour variation selling only 4 units a day with the same 35-day lead time and 30 days of safety stock:
- Reorder point = (4 × 35) + (4 × 30) = 140 + 120 = 260 units
That gap matters. Managing to the parent-level average would have left the slow variation drastically overstocked and the fast one at constant risk of stockout. Refresh these numbers weekly per FNSKU, not monthly per parent.
When do Amazon’s own tools stop being enough?
Amazon gives you a genuinely useful starting point, but it has a ceiling.
The FBA Inventory tool inside Seller Central gives demand planning, restock recommendations, and low-stock alerts, and it’s the tool Amazon itself uses to calculate your IPI. It’s reliable for single-marketplace sellers with straightforward catalogues, but its recommendations are marketplace-level and don’t account for your actual profit margins per SKU.
For sellers who need machine forecasting at scale, Amazon Forecast produces probabilistic forecasts rather than single point estimates, and it can ingest external variables such as weather, promotions and price changes to sharpen accuracy. Amazon’s own supply chain optimisation work proves the same principle at enormous scale: multi-horizon, quantile-based forecasts consistently outperform single-number predictions because they treat demand as a range, not a guess.
Third-party software becomes necessary once you’re selling across multiple channels, managing more than roughly 100 SKUs, or need per-FNSKU automation that ties reorder points directly to profit rather than just unit volume. That’s the point where the FBA Inventory API becomes useful too, giving programmatic visibility into fulfillable, inbound, reserved, and unfulfillable stock for automated summaries.
- Native FBA tool: fine for single-marketplace, simple catalogues
- Amazon Forecast: probabilistic ML forecasts, strong with external variables
- Third-party automation: needed at scale, multi-channel, or profit-linked reorder logic
Why do most Amazon forecasts fail in practice?
Most forecasting failures trace back to a handful of repeat offenders, and they’re fixable once you know what to check.
- Using quoted lead times instead of measured ones. A factory’s 21-day quote rarely includes production queue time, freight transit, customs, and FC receiving delays.
- Ignoring promotions and channel shifts. A forecast built on organic sales alone underestimates demand the moment a deal goes live, or overestimates it once the deal ends.
- Overcorrecting into excess safety stock. Padding every SKU with 60+ days “just in case” invites aged-inventory surcharges rather than preventing stockouts.
- Forecasts that ignore receiving reality. A forecast means nothing if FC check-in delays routinely add a week that the plan never accounted for.
Pro Tip: If your stranded inventory keeps climbing despite an accurate forecast, the problem usually sits in receiving and listing status, not demand prediction. Fix the reconciliation gap before touching the forecast model.
The publisher’s view: closing the loop between forecast and profit
A forecast that predicts units without predicting profit is only half the job. Some inventory modules sync with Amazon’s API to track per-FNSKU reorder points alongside margin data, so reorder decisions can reflect earnings, not just sales velocity.
That link between stock and profit changes priorities. A fast-moving but thin-margin variation might warrant a smaller safety buffer than a slower SKU with a wide margin, and profit-aware reorder logic surfaces that automatically instead of leaving it to guesswork.
How does forecasting fit into procurement and supply chain planning?
Forecasting only works when it feeds decisions upstream of Amazon, not just inventory levels inside FBA. Your reorder point calculation is meaningless if procurement is still working off last quarter’s purchase order schedule. The two need to run on the same clock.
That means treating your supplier relationships as part of the forecasting system, not a separate function. If your measured lead time has crept from 28 days to 40 over the last two quarters, that’s not just an inventory problem, it’s a procurement signal that your supplier’s production queue is getting longer or your freight forwarder has changed routes. Feed that measured lead time back into supplier negotiations and purchase order timing, rather than letting procurement work from the original quote indefinitely.
Multi-echelon thinking helps here even for smaller catalogues. Amazon’s own inventory planning system evolved around the idea that inventory decisions at one point in the supply chain, whether that’s a factory, a freight consolidation point, or an FBA warehouse, affect every other point downstream. A seller running three suppliers for the same product category can borrow that logic by staggering purchase order timing across suppliers rather than ordering from all three on the same cycle, which smooths out the risk of one delay stalling the entire replenishment plan.
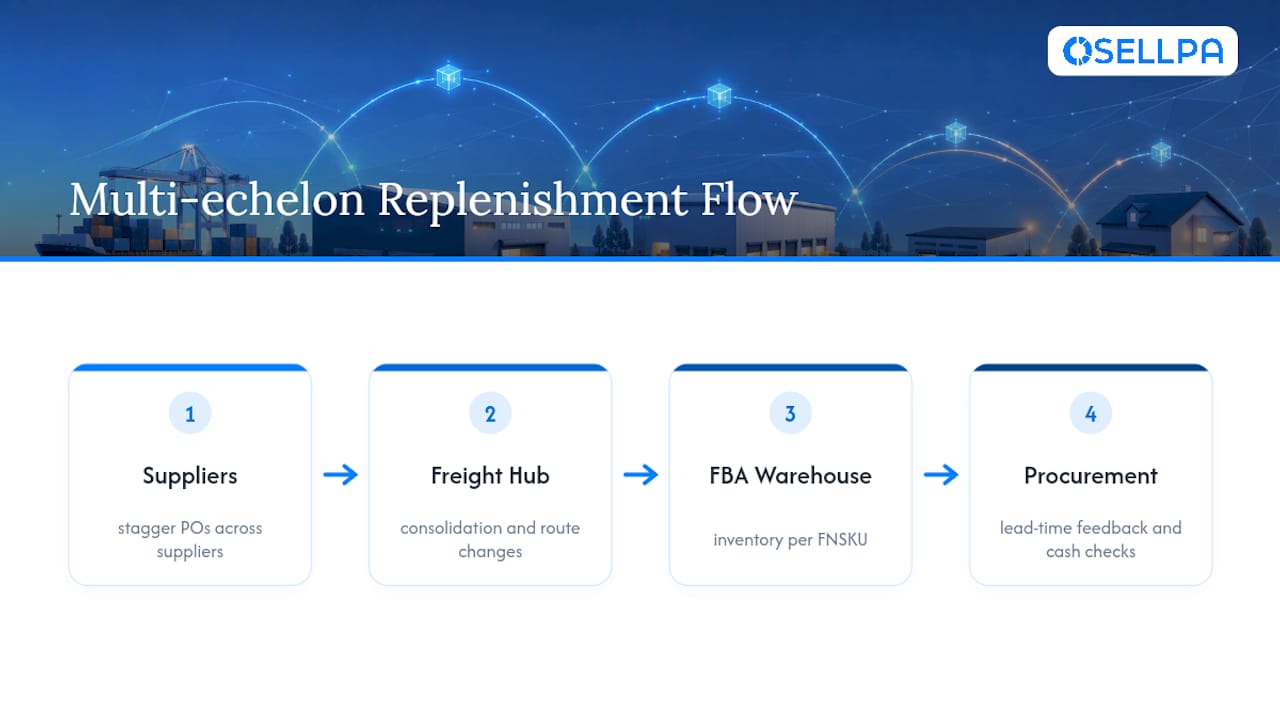
Procurement planning should also flag capital constraints before a forecast demands more cash than you have available. A forecast that says “reorder 5,000 units” is only useful if it arrives alongside a realistic view of payment terms, deposit schedules, and cash flow timing.
How should you adjust forecasts when demand or supply breaks pattern?
Unexpected events break every forecasting model built on historical averages, which is most of them. The fix isn’t a better model, it’s a faster response process.
For sudden demand spikes, whether from a viral moment, a competitor stockout, or an unplanned promotion, shorten your review cycle from weekly to daily until velocity stabilises. Recalculate days of supply against the new velocity immediately rather than waiting for the next scheduled review, and check whether an expedited shipment is worth the extra freight cost against the lost sales from a stockout.
For supply disruptions, whether a factory delay, a port backlog, or a customs hold, the priority shifts to protecting your highest-velocity FNSKUs first. Not every variation deserves equal protection when supply is constrained; a slow-moving colour option can absorb a stockout far more easily than your bestseller can.
Build a standing playbook for both scenarios before you need it. Decide in advance which SKUs get priority when supply is tight, what expedited freight budget you’re willing to spend to prevent a stockout on a top performer, and at what DOS threshold you escalate from routine reorder to emergency response. Making these decisions calmly in advance beats making them under pressure when a container is stuck at customs and your bestseller has nine days of stock left.
External shocks also demand a return to normal cadence once resolved. Sellers who keep emergency-mode safety stock levels long after a disruption clears often find themselves back in aged-inventory surcharge territory within a quarter.
What does successful forecasting actually look like in practice?
The pattern among sellers who forecast well isn’t a fancier model, it’s tighter discipline around the same basics repeated every week.
A seller managing a catalogue of 40 to 50 SKUs across several parent listings typically sees the clearest gains from splitting forecasts by FNSKU rather than by parent ASIN. A single parent listing can mask wildly different velocities between colour or size variations, and a seller who moves from parent-level to variation-level reorder points usually cuts both stockouts on fast variations and aged-stock buildup on slow ones within a couple of replenishment cycles.

Sellers who survive supply shocks well share a common trait: they had already measured true lead times before the disruption hit, so when freight times doubled during a port backlog, they recalculated reorder points from a baseline that was already accurate rather than starting from a factory quote that was wrong to begin with.
The sellers who struggle most tend to share the opposite pattern: forecasting built once at launch and never revisited, safety stock set arbitrarily rather than calculated, and lead times taken from the original supplier agreement regardless of how freight routes or factory capacity have shifted since. The fix in every case observed is the same unglamorous one: pull the data, measure the real lead time, recalculate the reorder point, and do it again next week.
Weekly habits that keep forecasts honest
The sellers who avoid stockouts and surcharges share a routine, not a secret formula. Monday mornings go to reviewing velocity shifts and open purchase orders against current stock. When aged-inventory risk creeps up, shorter and more frequent shipments beat one large restock. And lead times get remeasured from the most recent purchase orders, never assumed from the last quote.
— Harry
Let Osellpa turn your forecast into a reorder plan
There are other ways to forecast Amazon inventory, from Seller Central’s own tools to a well-built spreadsheet, but neither ties stock decisions to what each SKU actually earns you. Certain software tools sync directly with Amazon’s API to generate per-FNSKU reorder points, weekly automated inventory reports, and profit-aware triggers that flag which SKUs deserve priority when cash or capacity is tight.
In practice, that means fewer stockouts on your best-margin products, safety stock sized to real lead times rather than guesswork, and clear visibility into which reorder decisions actually protect profit rather than just unit volume.
If you’re still calculating reorder points by hand, start a trial of the Amazon inventory management software and see your per-FNSKU triggers built automatically from your own sales history.


