
Set a cost-based price floor for every SKU, switch on automated repricing within that floor and a sensible ceiling, and reserve manual, value-led pricing for anything genuinely differentiated. That sequence protects margin while letting you compete on speed. Tools like Amazon’s own pricing dashboards and specialized analytics platforms exist to make that floor and automation easier to run without guesswork.
TL;DR:
- Setting a cost-based price floor and automating repricing within a defined ceiling helps protect margins while remaining competitive on Amazon.
- Different SKUs require tailored pricing strategies: low prices for commoditized products, value-based for differentiated brands, and penetration for new launches.
- Amazon’s Buy Box favorably considers fulfillment method and seller performance, making fast reaction times crucial for automated repricers during high-traffic periods.
- Proper calculation of the price floor involves detailed fee components, including landed cost, referral fees, storage, advertising, VAT, return buffers, and overheads.
- Using tools like Amazon’s Pricing Health and third-party charts ensures informed pricing decisions, while strict compliance with pricing policies avoids suspensions and penalties.
Table of Contents
- What pricing strategies work best for Amazon sellers?
- How does Amazon’s Buy Box actually decide who gets the sale?
- How do you calculate your Amazon price floor?
- Should you use rule-based or algorithmic repricing?
- How should pricing change across a product’s lifecycle?
- Which tools actually show you what’s happening to your prices?
- What compliance rules should you check before changing prices?
- How Osellpa fits into a working pricing setup
- Price as a lever, not a set-and-forget decision
- Turning this pricing playbook into a repeatable system
- Sources
What pricing strategies work best for Amazon sellers?
Not every SKU should be priced the same way, and treating them identically is one of the fastest routes to margin erosion. The right strategy depends on what you’re actually selling and how much control you have over the listing.
Competitive or lowest-price pricing suits resellers and arbitrage sellers on undifferentiated ASINs, where the Buy Box goes to whoever matches the market price with the strongest fulfilment metrics. It maximises visibility but compresses margin, so it only works if your cost base is genuinely lower than the competition’s.
Value-based pricing fits private label and branded products with a real point of difference, such as a patented mechanism, a superior material, or bundled accessories. You price against the value delivered rather than the cheapest competitor, which protects margin but demands stronger listing content to justify the premium.
Penetration pricing deliberately undercuts the market at launch to generate the review velocity and sales history that Amazon’s ranking algorithm rewards. Expect thin or negative margin for the first few weeks, in exchange for faster organic visibility.
Premium pricing works when brand trust or exclusivity is the product itself. Psychological pricing (£19.97 instead of £20) nudges conversion at the margin. Loss-leader pricing sacrifices margin on one SKU to pull traffic toward a higher-margin catalogue, which only makes sense if you can measure the halo effect across your full range.
- Competitive: high visibility, thin margin, best for commoditised SKUs
- Value-based: moderate visibility, protected margin, needs differentiation
- Penetration: strong early growth, negative or low margin, time-limited
- Premium: lower volume, high margin, dependent on brand equity
- Loss leader: sacrifices unit margin for catalogue-wide lift
How does Amazon’s Buy Box actually decide who gets the sale?
The Buy Box, now more often called the Featured Offer, is not a simple lowest-price auction. Amazon weighs price alongside fulfilment method, seller performance metrics, stock depth and delivery speed, and an FBA seller with a slightly higher price frequently beats an FBM seller with a lower one because of guaranteed dispatch times and returns handling.

Amazon has been explicit that its pricing team’s mandate is to keep prices competitive across a huge selection rather than to maximise short-term profit on any single item, and it compares prices across thousands of retailers while showing customers 365 days of price history on the product page. That price-history feature matters more than most sellers realise: it undercuts the effectiveness of an artificial “was” price, because shoppers can see whether a discount is real or cosmetic, which makes promotional cadence a visible signal rather than a private lever.
This transparency also shapes how algorithmic repricing behaves at scale. When thousands of sellers on the same ASIN run automated repricers, you get reactive price-matching and, at times, coordinated upward drift as algorithms respond to each other’s signals rather than to underlying demand. The practical takeaway is timing: Buy Box ownership can shift within minutes during high-traffic windows, so a repricer with slow reaction times will lose share to a faster one even at an identical price point. Given the scale of Amazon’s overall retail volume, these platform-level dynamics affect a very large number of sellers simultaneously, not just a handful of niche categories.
How do you calculate your Amazon price floor?
Your price floor is the lowest price at which a sale still makes commercial sense, and it needs to be a real number before you switch on any repricer, not a rough guess.
- Landed cost — unit cost plus freight, duty and any inspection fees.
- Referral fee — Amazon’s category-based percentage, typically 8 to 15%.
- FBA fulfilment fee — the pick, pack and ship charge for the item’s size tier.
- Storage allocation — monthly storage fee divided across expected units sold that month.
- Advertising allocation — your average PPC spend per unit sold, not per click.
- VAT — output VAT due on the sale, where applicable to your registration status.
- Returns buffer — a per-SKU allowance based on category return rates; footwear and apparel need a noticeably larger buffer than accessories or consumables, since a small number of ASINs typically drive most return costs.
- Overhead allocation — a modest per-unit share of fixed costs.
A worked example: a kitchen gadget with a £4.50 landed cost, £2.10 referral fee, £3.80 FBA fee, £0.40 storage allocation, £1.20 advertising allocation, £0.90 VAT liability and a £0.35 returns buffer totals £13.25 in unavoidable costs. Add £1.75 overhead and your floor sits at £15.00. Sell below that and you are funding growth with your own capital, deliberately, rather than by accident.
Your ceiling should be set from historical conversion data, not intuition. If sales volume holds steady up to £21.99 but drops sharply above it, that’s your practical ceiling regardless of what competitors charge. A robust floor calculation that includes every fee line is the difference between a sustainable price and a slow bleed you won’t notice until quarter-end.
Should you use rule-based or algorithmic repricing?
Once you’re managing more than a handful of SKUs, or your category sees frequent price changes from competitors, manual repricing stops being viable. A catalogue of 50 or more ASINs in a competitive niche, or any SKU that loses Buy Box share more than a few times a week, is the practical threshold for switching to automation.
Rule-based repricers follow fixed logic (“match the lowest FBA price minus one penny, never below my floor”). Algorithmic repricers factor in additional signals, such as competitor stock levels, seller ratings and historical Buy Box win rates, to make less predictable but often more profitable decisions.
- Set your floor and ceiling first, sourced from the cost model above, never from a competitor’s price.
- Configure reaction delay carefully; too fast and you contribute to a race to the bottom, too slow and you lose Buy Box windows.
- Define a share-of-buy-box target rather than chasing 100% ownership, which usually means you’re underpriced.
- Review repricer logs weekly to catch oscillation, where two automated sellers repeatedly undercut each other in penny increments.
The most common failure mode is a “wait my turn” cycle, where several repricers each drop price the moment they lose the Buy Box, spiral overnight, and recover only when a human intervenes. A properly configured repricer functions as an enforcement mechanism for your floor and ceiling, not a substitute for having set them correctly in the first place.
Pro Tip: Run your repricer with a minimum margin buffer above your true floor, not directly on it. A one or two percent cushion absorbs currency fluctuations and unexpected fee changes without triggering a manual review every time.
How should pricing change across a product’s lifecycle?
Pricing is not a single decision made at listing creation. It shifts as a SKU moves through distinct phases, and treating launch pricing as permanent is one of the more common margin mistakes sellers make.
- Launch — use penetration pricing to build review velocity and sales rank quickly, accepting thin margin for a defined window, typically two to six weeks, then plan the increase in advance rather than reacting to it.
- Growth — once reviews and differentiation are established, shift toward value-based pricing that protects margin, using Buy Box win rate data to confirm the higher price still converts.
- Peak events — during Prime Day or the Christmas period, raise prices cautiously if stock is limited, and synchronise any promotion with your advertising bids so ad spend and price move together rather than working against each other.
- Clearance — for ageing or excess stock, use a structured markdown cadence, coupons and Lightning Deals rather than one large price cut, which preserves more margin while still moving inventory.
Which tools actually show you what’s happening to your prices?
Guessing at competitor behaviour is the fastest way to make a bad pricing decision, and Amazon now gives sellers genuinely useful native tools for this.
Pricing Health, inside Seller Central, flags pricing errors, surfaces Pricing Opportunities where you’re underpriced relative to the Featured Offer, and highlights listings at risk of losing Buy Box eligibility. Automate Pricing lets you build rule-based repricing directly on the platform without third-party software, which is documented in Amazon’s own seller guidance.
Third-party trackers add the historical context Amazon’s own dashboards don’t show as clearly. Keepa and CamelCamelCamel chart months or years of price movement on any ASIN, letting you tell whether a competitor’s current price is a temporary dip or their established level.
- Check Buy Box ownership and Pricing Health alerts daily during peak periods.
- Review historical price charts on Keepa or CamelCamelCamel weekly for your top competitors.
- Track margin per unit, not just revenue, on every pricing decision.
What compliance rules should you check before changing prices?
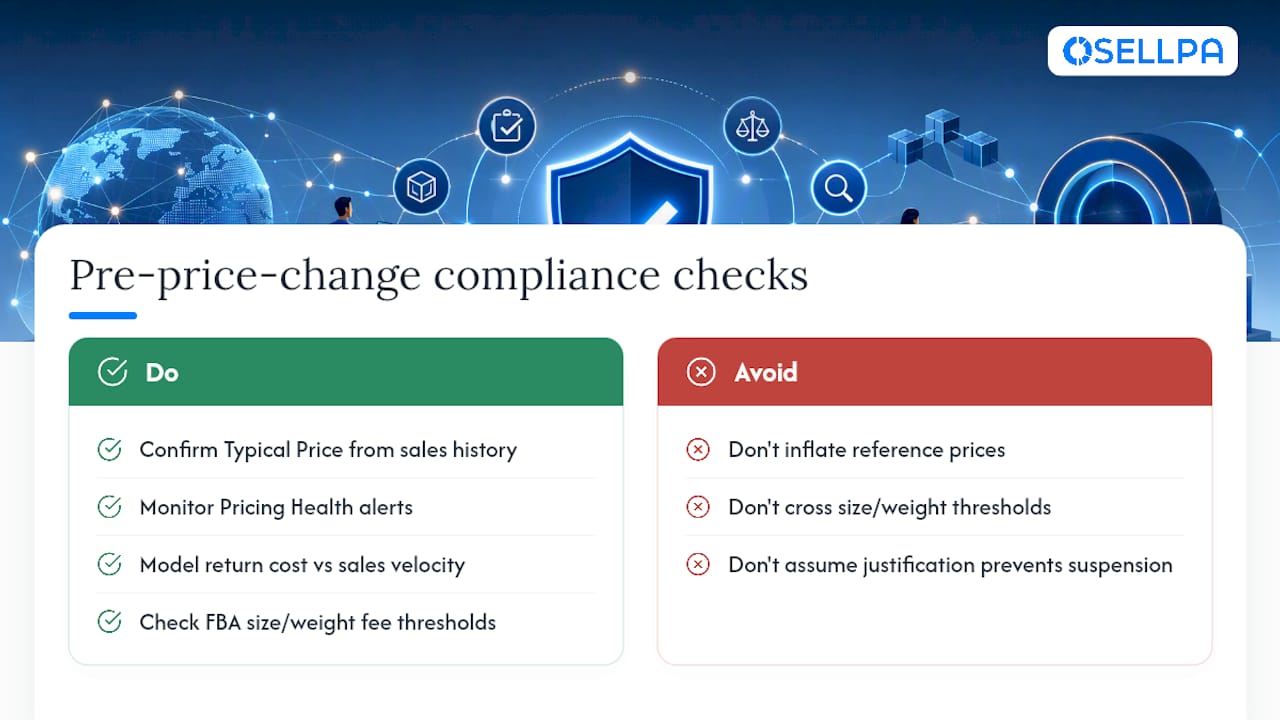
Amazon tightened its reference-price and strike-through rules significantly in the past two years, and getting this wrong now carries real listing risk. A “was” price can only be displayed if it reflects a genuine Typical Price calculated from recent sales history, and inflating a reference price to make a discount look larger can get the strike-through removed or the listing flagged.
Fee structures have also shifted, with several fee cliffs introduced across FBA and storage tiers in 2025 and into 2026, where crossing a size or weight threshold by a fraction changes your fulfilment cost bracket entirely. That makes packaging dimensions a pricing decision, not just a logistics one.
Amazon’s Marketplace Fair Pricing policy can suspend Featured Offer eligibility if pricing practices appear to damage customer trust, even when the seller believes the price is justified. Run two checks regularly: monitor Pricing Health alerts for fair-pricing warnings, and model your return costs per SKU against current sales velocity, since a rising return rate quietly erodes the margin your floor was built to protect.
How Osellpa fits into a working pricing setup
Building the floor formula above by hand in a spreadsheet works until your catalogue grows past a dozen SKUs, at which point fee changes and return-rate shifts get missed. Osellpa connects directly to Amazon’s API to pull landed cost, fee data and per-unit profit automatically, so your floor updates when fees change rather than staying stale for months.
Once automated repricing is live, measure results over a 30-day window: track Buy Box win rate, net margin per unit, and advertising cost per sale against the previous 30 days. Osellpa’s profit tracking and PPC optimisation run against this same data set, which means you’re checking repricer performance against real profit, not just top-line sales.
Price as a lever, not a set-and-forget decision
Most sellers treat pricing as something you decide once and revisit only when sales fall off, but the sellers who consistently win Buy Box share treat it as a live input they check weekly, sometimes daily. The floor calculation is not a one-off spreadsheet exercise; fees change, return rates drift, and a floor built in January can be wrong by March.
What genuinely separates a sustainable pricing setup from a fragile one isn’t the sophistication of the repricer, it’s whether the floor underneath it was calculated properly in the first place. Automation enforces a decision. It doesn’t make a bad one good. Get the floor maths right, watch it monthly, and the repricer becomes a genuine advantage rather than a fast way to lose money. For more practical breakdowns like this, the Osellpa blog covers the mechanics in more depth.
— Harry
Turning this pricing playbook into a repeatable system
Running the floor formula, watching Pricing Health alerts and reviewing Keepa charts by hand is manageable for a handful of SKUs. It stops being manageable once your catalogue grows, and that’s precisely the gap Osellpa is built to close. Rather than rebuilding your cost model in a spreadsheet every time a fee changes, Osellpa pulls landed cost, referral fees and FBA charges directly from Amazon’s API and turns them into a live per-unit profit figure, so your floor stays accurate without manual updates.
The performance dashboard shows margin, Buy Box win rate and PPC spend per unit side by side, which is exactly the data you need to judge whether a repricer is actually protecting profit or just winning volume at a loss. If advertising costs are the piece you’re least confident about, start with the free PPC bid optimisation report to see where ad spend is quietly eating into the margin your price floor was meant to protect.


