
Order defect rate (ODR) measures the percentage of your Amazon orders that receive negative feedback, an A-to-z Guarantee claim, or a service chargeback. Amazon’s policy threshold is strict: your ODR must stay under 1% over any rolling 60-day window, or you risk listing restrictions and account suspension. You can check it daily in your Account Health Dashboard, and tools like Amazon seller analytics platforms can help you spot a spike before it becomes a policy problem.
TL;DR:
- Maintaining an ODR under 1% over a 60-day rolling window requires monitoring all three defect types: negative feedback, A-to-z claims, and chargebacks, which all count equally regardless of order value.
- A single defect on a low-value order can disproportionately impact your defect rate if your order volume is small, making scale an important buffer against policy breaches.
- Defects from claims and chargebacks can surface 30 to 90 days after the order, causing volatility that demands real-time daily tracking and swift action.
- Responding within the first 72 hours by addressing affected customers and switching problematic carriers can prevent escalation to account suspension.
- Automating defect monitoring, review requests, and inventory alerts shortens recovery time and reduces reliance on manual tracking tools.
Table of Contents
- What order defect rate measures: the three components
- How Amazon calculates ODR and the rolling window
- Where to check ODR and how to monitor it daily
- What happens when ODR climbs above 1%
- Concrete steps to investigate and reduce ODR
- How analytics and automation shorten recovery time
- The 72-hour recovery priority list
- Monitor and fix ODR without living in spreadsheets
- Sources
What order defect rate measures: the three components
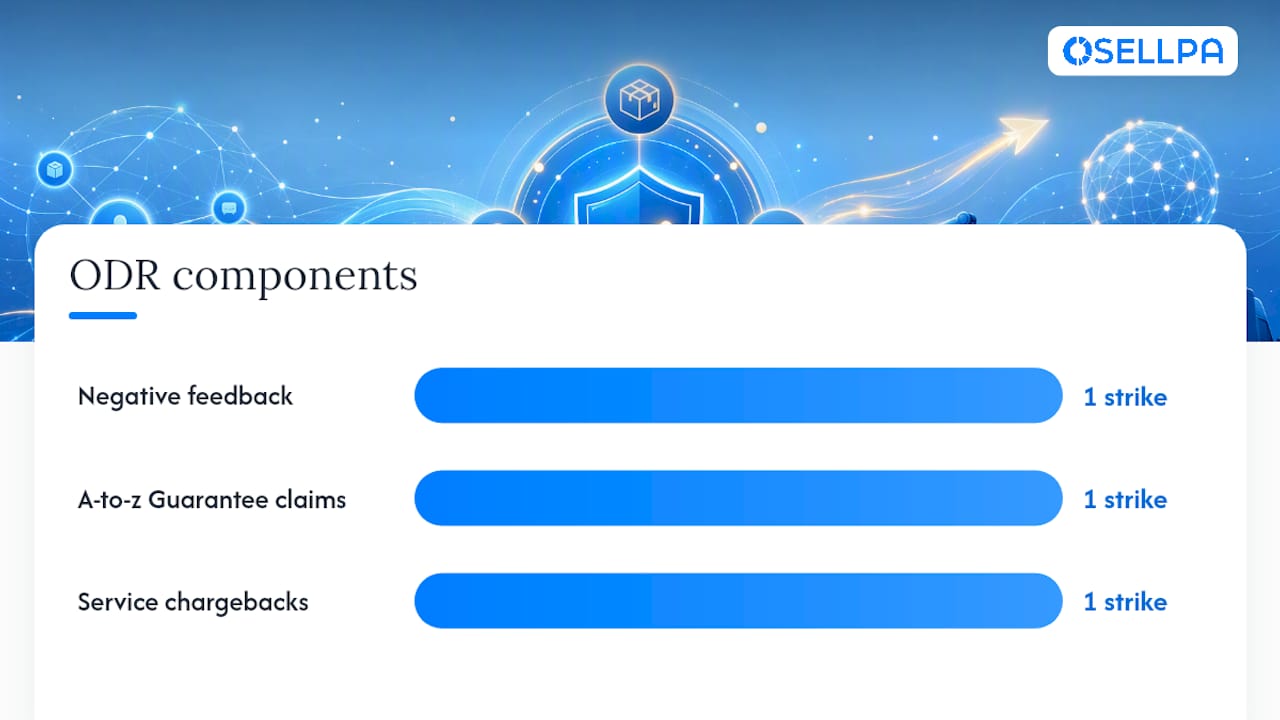
ODR is not one number pulled from a single source. It’s built from three distinct buyer-triggered events, and any one of them counts against you:
- Negative feedback — a 1 or 2-star rating left on an order
- A-to-z Guarantee claims — a buyer formally disputes an order through Amazon’s claims process
- Service chargebacks — the buyer’s card issuer reverses payment on a completed order
Here’s the part sellers often miss: ODR is order-correlated, not value-weighted. A £4 keyring with a bad review counts exactly the same as a £400 defect on a bulk order. One negative event, one strike against your rate, regardless of the order’s size.
There are limited exceptions. If a claim is denied on review, or the buyer withdraws it before Amazon processes it, it may not register as a defect. That said, Amazon’s own guidance makes clear these are edge cases, not something to plan around.
How Amazon calculates ODR and the rolling window
The formula is simple: (orders with defects ÷ total orders) × 100. What trips sellers up is the timing behind it.
Amazon assesses ODR over a rolling 60-day window, but defects don’t always show up immediately. A-to-z claims and chargebacks in particular can surface 30 to 90 days after the original order date, because buyers have that long to raise a dispute. That means the ODR you see today can understate problems from orders shipped weeks ago. It also means a “clean” week can turn ugly retroactively, once delayed claims land.
This lag creates real volatility for lower-volume sellers. If you ship 50 orders a month, a single defect moves your rate by 2 percentage points, comfortably above the 1% ceiling on its own. Sellers doing thousands of orders a month barely feel the same defect. Scale is your buffer here, and if you don’t have it yet, every order matters more.
Where to check ODR and how to monitor it daily
Your ODR lives in Account Health → Customer service performance, where Amazon breaks the number down by defect type so you can see whether feedback, claims, or chargebacks are driving the trend. Sellers who check this dashboard daily catch problems while they’re still small, rather than discovering a spike two weeks after it started.
For a morning triage routine, work through this order:
- Pull the ODR breakdown and note which of the three defect types has moved
- Filter recent defect orders by SKU to spot a specific product driving the issue
- Filter by carrier and fulfilment type to rule out a shipping or warehouse problem
- Cross-check against any recent listing, price, or supplier changes
Third-party seller data suggests treating 0.75% as your internal alert line, rather than waiting until you’re already at Amazon’s 1% ceiling. If you export data programmatically, Amazon’s SP-API report types expose fields including orderDefectRate, orderDefectMetrics, and orderWithDefects, useful if you’re feeding defect data into your own reporting stack.
That quarter-point buffer gives you time to fix the problem before Amazon’s system flags your account.*
What happens when ODR climbs above 1%
Cross the 1% line and the response from Amazon is not gradual. Expect an account health warning first, often paired with restrictions on specific listings tied to the defect pattern.
If the rate doesn’t recover, the situation escalates to a full account review, and repeated or unresolved breaches can lead to suspension. Amazon typically wants evidence during a review: proof you’ve identified the root cause, changes made to your process, and confirmation that affected customers were remediated. Screenshots from your Account Health Dashboard and your own order records become your strongest evidence in that conversation, so keep them organised as you go rather than scrambling to reconstruct a timeline later.
Concrete steps to investigate and reduce ODR
Fixing ODR is a layered job that benefits greatly from understanding analytics’ role, as explained in the role of onsite search analytics. Some actions stop the bleeding today; others prevent the next spike.
Immediate triage:
- Export the last 60 days of defect orders and sort by SKU, carrier, and fulfilment type to isolate the pattern
Customer remediation:
- Issue proactive refunds or replacements on affected orders before the buyer escalates to a formal claim
- Build A-to-z responses with tracking numbers, delivery confirmation, and communication logs as evidence
Product and listing fixes:
- Correct images, descriptions, or claims that are setting the wrong expectation and driving returns
- Add packaging notes or usage instructions where confusion is causing negative feedback
Fulfilment and logistics:
- Switch carriers on routes with a pattern of late or damaged deliveries
- Move problem SKUs into FBA if self-fulfilment is the common thread
Prevention:
- Schedule automated review requests to grow your legitimate positive feedback volume
- Set inventory alerts so stockouts don’t force rushed, error-prone fulfilment decisions
Seller-side guides consistently point to the same pattern: sellers who act on the immediate triage list within days recover faster than those who wait for the monthly numbers to force their hand.
How analytics and automation shorten recovery time
Manually cross-referencing SKUs, carriers, and feedback timestamps across a spreadsheet is where most sellers lose days they don’t have. A connected dashboard that already ties your order data to defect type cuts that diagnosis time from days to minutes, because the filtering is already done for you.
Automation compounds the benefit. Automated refund workflows resolve buyer complaints before they turn into A-to-z claims. Sequenced review-request tools boost your positive feedback volume so a handful of bad reviews carry less weight. Inventory flags catch stock problems before they cause a fulfilment defect, and PPC de-prioritisation can quietly pull ad spend away from a SKU that’s currently driving your defect rate, buying you time to fix it without burning budget on the problem.

Combining refund automation with automatic evidence collection for A-to-z responses reduces the time sellers spend on appeals and tends to lower repeat defects, because root causes get addressed faster rather than patched order by order.
The 72-hour recovery priority list
If your ODR has spiked, the first 72 hours decide whether this becomes a footnote or a suspension letter. Triage first: pull every defect order from the last 60 days and find the common thread. Contact affected customers directly within the first day, before Amazon’s own claim process takes it out of your hands. If a carrier or fulfilment method is the culprit, make the switch immediately rather than waiting for the next shipping cycle. Then monitor daily, not weekly, until the rate stabilises.
Customer remediation and fulfilment changes move the number fastest. Listing rewrites and packaging fixes matter, but they’re a slower burn, prevention for the next quarter rather than a cure for this week. Fix that order, watch the trend for a week, and judge the pattern, not the blip.
— Harry
Monitor and fix ODR without living in spreadsheets
Chasing defect patterns across Seller Central reports, feedback emails, and carrier data manually is exactly the kind of work that eats a seller’s week for no real payoff. Some seller tools offer a live performance dashboard that surfaces your ODR trend and breaks defects down by SKU and fulfilment type automatically, so you’re not rebuilding that view from scratch every time something looks off.
The workflow is straightforward: an alert flags a rate change, you filter the dashboard to find the SKU or carrier behind it, then run an automated review request to rebuild your positive feedback ratio while inventory alerts catch the next stock problem before it becomes the next defect. Start a trial on the performance dashboard and see your current ODR trend the moment you connect your account.


