
The Market Basket Analysis report shows which ASINs customers buy most often alongside yours, ranked by a “combination %” figure for the top three co-purchased products. It sits inside Brand Analytics in Seller Central. Once you know which items pair up, you can build bundles, retarget those ASINs with Sponsored Products, or rethink your assortment. The report is free to any brand-registered seller, and checking it takes about five minutes.
TL;DR:
- The combination percentage in the report indicates how often your product appears with another in multi-item orders, but it should be supported by high order volume to avoid statistical noise.
- A combination percentage near or above 10% is typically worth testing further, provided your sales volume exceeds around 50 orders in the selected time window.
- Automated tools linking profit, PPC, and inventory data can help identify which co-pairings truly drive revenue and margin, especially for larger catalogues.
- A high combination percentage can be misleading if driven by promotions, seasonality, or listing mismatches, so always verify raw order counts before acting.
- Testing a virtual bundle or targeted PPC campaign over two to four weeks is essential to validate whether co-purchases translate into actual sales increases.
Table of Contents
- Finding market basket analysis Amazon data in Seller Central
- Reading the combination percentage, support, confidence, and lift
- Turning a co-purchase signal into bundles, ads, and assortment moves
- Why a high percentage can still be a false signal
- A step-by-step test for a new co-purchase opportunity
- Automating the boring parts of basket analysis
- How Amazon builds the market basket analysis behind the scenes
- Which sellers should act on this first
- Sources
- FAQ
Finding market basket analysis Amazon data in Seller Central
You’ll find the report under Brand Analytics inside Seller Central, not in your standard sales dashboard. Navigate to Reports, then Brand Analytics, then select Market Basket Analysis from the left-hand menu. Only brand-registered sellers can see it, which catches out a fair number of newer accounts.
Before you read anything into the numbers, set your filters properly:
- Brand and category filters, so you’re not comparing your children’s toy against unrelated ASINs in a different catalogue entirely.
- Time window, typically 30, 90, or 365 days. Amazon’s help documentation on the Market Basket Analysis dashboard confirms the report is built to surface top co-purchased ASINs alongside their combination percentages.
- ASIN-level view, since the report works product by product rather than at the parent-listing level.
The table itself lists your ASIN and product title, then three columns for the #1, #2, and #3 most commonly co-purchased products, each with its own combination percentage. A longer time window smooths out noise but can bury recent shifts in buying behaviour; a shorter one reacts faster but risks small-sample distortion, which we’ll come back to.
Reading the combination percentage, support, confidence, and lift
The combination % is roughly the share of multi-item orders containing your ASIN that also included the paired product. It’s a simple ratio, not a weighted or adjusted score, and Amazon’s own documentation on the Market Basket Analysis Report confirms this top-3 structure with accompanying percentages.
That single number hides three concepts worth knowing, even though Amazon doesn’t display them separately:
- Support measures how often the pairing happens across all orders, not just yours.
- Confidence measures how likely the second item is, given someone bought the first.
- Lift measures whether that pairing happens more than chance would predict. This is the one that matters most: a wildly popular item can co-appear with everything simply because it sells constantly, not because it’s genuinely related.
Analytics guides on market basket cross-selling treat lift as the safeguard against chasing coincidental pairings rather than real customer intent.
Statistic callout: Sellers commonly treat a combination percentage near or above 10% as worth testing further, but only once your order volume is high enough that the number isn’t being driven by a handful of transactions.
Turning a co-purchase signal into bundles, ads, and assortment moves
Spotting a strong pairing is the easy part. Acting on it well takes a bit more discipline.
- Test a virtual bundle first. List the two ASINs together without committing to new packaging or FBA prep, price it slightly below the sum of both items, and watch conversion rate and units over two to four weeks.
- Target the paired ASIN directly in PPC. If Product B shows up as your #1 co-purchase at 14%, run Sponsored Products against that exact ASIN and Sponsored Display against its category, rather than guessing at keywords.
- Add it to your listing’s cross-sell placements. A+ content modules and “frequently bought together” carousels convert better when the featured product is one your own data confirms, not one Amazon’s algorithm picked independently.
- Reassess your assortment. If the same pairing shows up quarter after quarter, it’s telling you something about how customers actually use your product, which can shape future product development, not just marketing.
MerchantSpring’s worked example on lifting average order value shows how to convert a reported combination % and your own sales volume into an estimate of expected incremental units, which gives you a rough revenue case before you commit shelf space or ad budget.
Pro Tip: Run the virtual bundle test before committing to physical packaging. If the uplift doesn’t hold after four weeks, you’ve lost nothing but a listing slot.
Why a high percentage can still be a false signal
A big number on the report doesn’t automatically mean a real opportunity. A handful of low-volume ASINs can produce a startling combination % purely because the sample is tiny, ten orders and three of them include a related item looks impressive until you realise it’s statistical noise.
Watch for these distortions before you act:
- Promotions and seasonality can temporarily inflate a pairing, particularly around lightning deals or holiday bundles that won’t repeat.
- Third-party variants and listing mismatches sometimes disguise the true product being paired, especially where multiple sellers list near-identical ASINs.
- Returns activity can also skew short-term patterns, since a spike in bundled returns looks similar to a spike in bundled sales until you check the numbers, a point echoed in seller guidance on returns and inventory recovery.
A high combination % with low order volume should prompt a deeper look, not an immediate rollout. Check the raw order count behind the percentage before you commit budget or inventory.
A step-by-step test for a new co-purchase opportunity
Run this as a proper experiment, not a guess dressed up as a decision.
- Shortlist candidates using a minimum sales threshold (say, 50+ orders in your chosen window) and a combination % that clears your own bar, often 10% or higher.
- Pick one test format, virtual bundle, a modest discount, or a targeted ad campaign, and set your success metrics before you launch.
- Run it for a fixed window, typically two to four weeks, tracking average order value, incremental units, and either TACoS or ROAS depending on whether it’s an organic or ad-led test.
- Compare results against your pre-set criteria and make a call.
| Decision | Trigger |
|---|---|
| Scale | AOV or incremental units rise meaningfully and hold for the full test window |
| Iterate | Some lift, but not enough to justify the current price or ad spend, adjust and retest |
| Drop | No measurable change, or the lift disappears once a promotion ends |
Skipping the fixed window is the most common mistake here. Sellers often call a test “successful” after four days because the numbers looked good, then watch the effect vanish once the promotional bump wears off.
Automating the boring parts of basket analysis
Checking this report manually every week is realistic for a five-SKU catalogue. It stops being realistic once you’re running fifty ASINs across multiple categories, and that’s where automation earns its keep.
The tasks worth automating are the repetitive ones: flagging when a co-purchase pairing crosses your combination % threshold, scheduling the report to run on a fixed cadence, and linking that ASIN-level signal to your actual profit and inventory position rather than just top-line sales. A pairing that looks exciting on revenue can be far less exciting once you factor in margin and stock depth.
This is the workflow Osellpa’s performance dashboard is built around: connecting directly to the Amazon API, then surfacing profit and PPC data alongside performance signals so a rising co-purchase pair doesn’t sit buried in a report nobody opened this month.
If you’re evaluating any tool for this job, run it against a short checklist:
- Does it integrate with the Amazon API directly, or does it rely on manual CSV exports?
- Can it schedule alerts rather than requiring you to remember to check?
- Does it connect ASIN-level signals to profit and loss, not just units sold?
- Does it tie into your existing ad reporting, so a bundling test and its PPC impact live in one place?
Pro Tip: Before automating anything, run one manual cycle of the checklist above by hand. It tells you exactly which step is eating your time, which is the step worth automating first.
How Amazon builds the market basket analysis behind the scenes
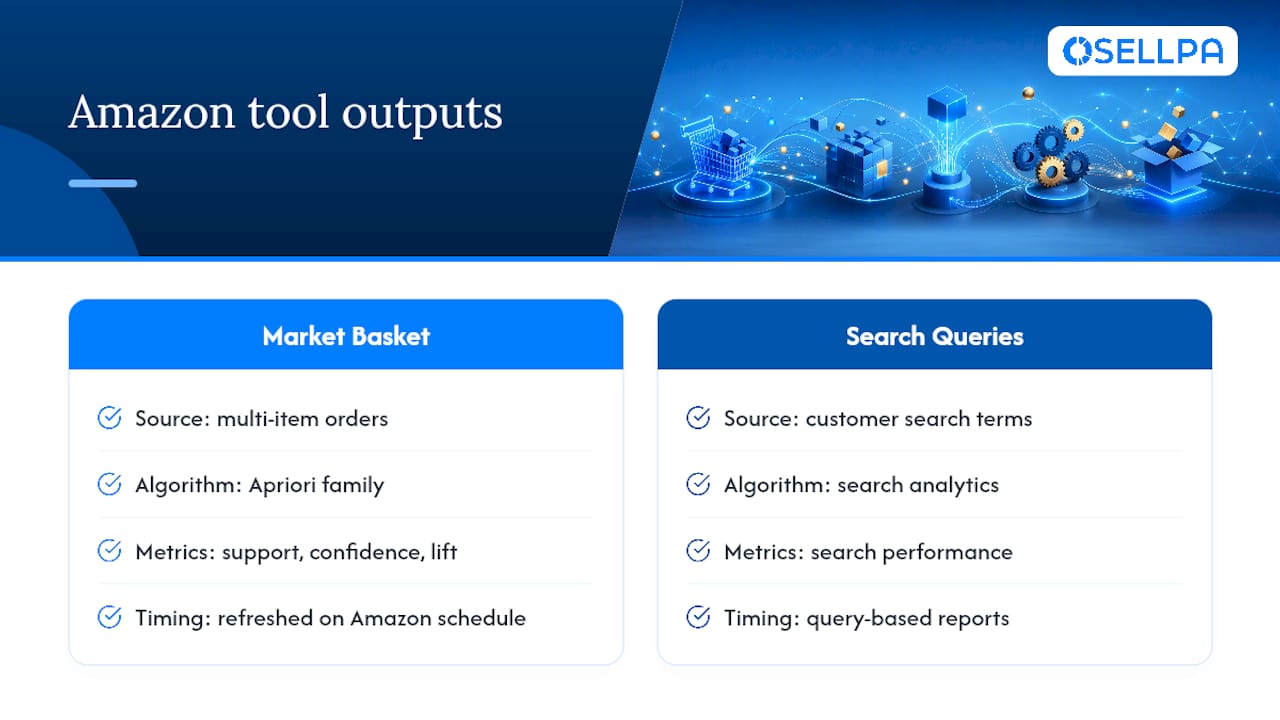
Amazon’s Market Basket Analysis draws on the same family of techniques retailers have used for decades, most notably algorithms descended from the Apriori method, which scans transaction data for items that repeatedly appear in the same order. Rather than analysing individual purchases in isolation, the system looks across millions of multi-item orders within a category or brand and counts how often specific ASIN pairs occur together.
Support, confidence, and lift, the concepts covered earlier, are the mathematical backbone of this kind of analysis generally, even though Amazon’s seller-facing report simplifies the output down to a single combination percentage per pairing, as detailed in guidance on Market Basket Analysis cross-selling strategies. The underlying data refreshes on Amazon’s own schedule rather than in real time, so a pairing that spikes today from a viral moment or a flash sale won’t show up in the report until the next update cycle.
This matters for how you use the tool. Market Basket Analysis is a rear-view mirror on customer behaviour, not a live feed. It’s excellent for spotting durable pairings that hold up over weeks or months, and considerably less useful for reacting to something happening this afternoon. Compare that with Amazon’s other Brand Analytics tools, Search Query Performance tells you what customers searched before buying, while Market Basket Analysis tells you what they bought alongside your product once they got to checkout. Used together, they cover both ends of the purchase journey.
Which sellers should act on this first
Catalogue size and traffic decide who benefits fastest here, in my view. A seller with three or four ASINs and steady order volume can validate a pairing within a fortnight and act on it with real confidence. A seller with two hundred SKUs and patchy traffic across most of them will spend weeks separating genuine signal from statistical noise, and that’s before any testing begins.
My honest advice: prioritise assortment decisions over ad experiments when a pairing shows up consistently across multiple time windows, that’s a product-level truth worth building into your catalogue, not just a campaign to run for a month. Save the PPC tests for pairings that look promising but haven’t yet proven themselves.
Start with your two or three highest-volume ASINs, run one bundle or one targeted campaign properly, and resist the urge to launch five tests simultaneously. You’ll learn more from one disciplined experiment than from five rushed ones, and you’ll actually be able to tell which change caused the result.
— Harry
Sources
FAQ
What does market basket analysis mean?
Market basket analysis is a data technique that identifies which products customers tend to buy together in the same transaction. On Amazon, it appears as a Brand Analytics report showing the top co-purchased ASINs for each of your products, along with a combination percentage for each pairing.
Can you give an example of market basket analysis in practice?
If you sell a yoga mat and the report shows a resistance band at a 15% combination rate, that means 15% of multi-item orders containing your mat also included that band. A seller might test a virtual bundle of the two products, or target Sponsored Products ads at the resistance band’s ASIN, to see whether that pairing converts into extra sales.
What market segmentation does Amazon use?
Amazon organises its catalogue by category and subcategory rather than publishing a single fixed segmentation model, and Brand Analytics filters, including Market Basket Analysis, follow that same category structure. Sellers effectively segment their own market by filtering reports to their specific brand, category, and time window.
What counts as an example of market analysis for a seller?
Reviewing your Market Basket Analysis report to spot a persistent co-purchase pairing, then testing a bundle or a targeted ad campaign against it, is a practical form of market analysis. It uses your own transaction data rather than external surveys, which makes the findings directly actionable.
How often does the Market Basket Analysis report update?
Amazon refreshes the underlying data on its own internal schedule rather than in real time, so recent spikes from promotions or viral moments may not appear immediately. Choosing a 90 day or 365 day window generally gives a more stable picture than a 30 day snapshot.