
Amazon Share of Voice (SOV) is the percentage of impressions your brand captures against total available impressions for a defined set of keywords, whether measured across paid placements, organic rankings, or both combined. If your SOV for a core category term sits at 15%, competitors are soaking up the other 85% of the visibility, and with it, the sales opportunity. Track it to decide where ad budget goes, whether a launch is landing, and whether a competitor is quietly encroaching on your category.
The basic formula: SOV (%) = Your impressions ÷ Total available impressions × 100.
- Segment by paid SOV, organic SOV, or total SOV — mixing them muddies the read.
- A rising SOV on branded terms usually signals defence is working; a falling SOV on category terms usually means budget or bids need attention.
Key Takeaways
Amazon Share of Voice measures your brand’s percentage of available impressions for a defined keyword set, and improving it requires accurate calculation, the right data sources, and consistent tracking.
| Point | Details |
|---|---|
| Choose the right formula | Use position-weighted SOV over basic unweighted when top-of-search performance drives your decisions. |
| Segment before you measure | Separate branded, category, paid, and organic SOV so the number answers a specific question. |
| Combine data sources | Cross-reference Amazon Ads reports, AMC, and rank trackers rather than trusting one source alone. |
| Use reserve SOV selectively | Reserve share of voice guarantees branded top-of-search visibility but doesn’t replace auction management. |
| Automate the tracking | Osellpa pulls SOV data automatically, applies top-of-search weighting, and optimises PPC to hold your target share. |
Table of Contents
- What is share of voice on Amazon and why does it matter?
- How do you calculate SOV on Amazon?
- Which keywords and placements should you measure?
- Where does SOV data actually come from?
- How do you track SOV over time?
- What is Sponsored Brands reserve share of voice?
- How do you improve your SOV on Amazon?
- How Osellpa helps you measure and defend your SOV
- Ready to stop guessing at your Amazon visibility?
- Frequently asked questions
- Sources
How do you calculate SOV on Amazon?
There are three calculation methods in common use, each trading simplicity for accuracy.
1. Basic unweighted SOV treats every impression equally, regardless of where it appeared.
Formula: SOV (%) = Brand impressions ÷ Total available impressions × 100
2. Position-weighted SOV gives more value to premium slots, since a top-of-search impression converts far better than one buried on page three.
Formula: SOV (%) = Σ(Impressions at position × weight for that position) ÷ Total weighted impressions × 100
3. Fold/area-weighted SOV goes further still, weighting by the actual screen real estate a placement occupies, useful for mobile-heavy categories where above-the-fold space is scarce.
Formula: SOV (%) = Σ(Impressions × visible area weight) ÷ Total weighted area × 100
Worked example. Say you pull data for a category keyword and count 1,000 total available impressions across the search results page. Your brand appears 220 times. Basic SOV: 220 ÷ 1,000 × 100 = 22%. Now weight it: if 60 of your impressions landed in top-of-search (weighted at 3x) and the remaining 160 landed lower (weighted at 1x), your weighted brand score is (60 × 3) + (160 × 1) = 340. If the weighted total for the whole category comes to 1,800, your position-weighted SOV is 340 ÷ 1,800 × 100 = 18.9%. Novadata’s own worked example follows the same logic: tally brand appearances across keyword pulls, divide by total placements.
| Method | Best for | Main drawback |
|---|---|---|
| Basic unweighted | Quick health checks, small keyword sets | Treats a page 3 impression the same as top-of-search |
| Position-weighted | Category leadership tracking, launches | Needs position-level data, harder to pull manually |
| Fold/area-weighted | Mobile-heavy categories, video/DSP mix | Most data-intensive, rarely worth it below enterprise scale |
Weighted models correlate more closely with actual sales outcomes than raw impression counts, since not every impression carries equal commercial value.
Which keywords and placements should you measure?
The number you get depends entirely on what you decide to measure. Get this wrong and SOV becomes a vanity metric instead of a decision-making tool.
Start with your keyword sets:
- Branded terms: your own brand name and product model numbers, where you should own the overwhelming majority of visibility.
- Category keywords: the generic terms customers search when they don’t yet know your brand exists.
- Top-converting keywords: the specific terms that historically drive the most sales, regardless of search volume.
Then decide on placements: top-of-search sponsored slots, product detail page placements (where competitors can appear on your own listing), and DSP or video impressions if you run upper-funnel awareness campaigns. Keep paid and organic SOV separate when you’re diagnosing a specific problem, a paid SOV crash points to a bidding or budget issue, while an organic SOV decline usually points to a listing or relevance problem.
Where does SOV data actually come from?
Five main sources feed SOV calculations, and each has real limitations worth knowing before you trust a number.
- Amazon Ads console reports give you your own impression and click data reliably, but not competitor volumes.
- Amazon Marketing Cloud offers the richest cross-channel view, stitching paid and organic together, though it requires technical setup and has a reporting lag.
- Search Terms/Reports show keyword-level performance but sample rather than capture every impression.
- Third-party rank trackers estimate total category impressions by scraping search results, useful for competitor visibility but never as precise as first-party data.
- DSP reporting covers display and video but sits in a separate reporting environment from search ads.
No single source gives a complete picture. Cross-reference at least two, and treat single-source SOV figures with some scepticism, especially anything pulled from a third-party scraper during a high-traffic period like Prime Day.
How do you track SOV over time?
A repeatable workflow beats a one-off audit every time. Define your keyword set first, choose your segmentation (paid, organic, or total), pull impression data on a fixed schedule, calculate SOV using a consistent method, then watch for trends and anomalies rather than single-day swings.
Tools built for this job should offer:
- Automated data pulls rather than manual exports every Monday morning.
- Top-of-search weighting built into the calculation, not just raw impression counts.
- AMC integration for advertisers who want the fuller cross-channel picture.
- Cross-marketplace roll-up if you sell in more than one country.
- Alerting when SOV drops below a threshold you set.
Manual tracking works fine for a handful of keywords and one marketplace. Once you’re managing dozens of campaigns across multiple markets, manual checks start missing things, automation becomes less a convenience and more a necessity for catching problems before they cost you a week of sales.
How do you improve your SOV on Amazon?
Raising SOV rarely comes down to one fix. It’s usually a combination of listing quality, advertising tactics, and budget discipline working together.
Start with the listing itself:
- Rewrite titles and bullet points around your top-converting keywords, not just the ones with the highest search volume.
- Add A+ Content and comparison charts, both improve conversion rate, which in turn improves your organic ranking and lowers your effective ad cost.
- Check Buy Box ownership and inventory levels regularly, a stockout during a strong SOV period hands your visibility straight to a competitor.
Then layer in advertising tactics:
- Protect branded terms first, they’re cheap to defend and expensive to lose.
- Expand into high-intent category keywords once branded terms are secure.
- Bid more aggressively for top-of-search placement specifically, since weighted SOV models show this is where the commercial value concentrates.
- Add DSP or video campaigns for upper-funnel awareness if your category has long consideration cycles.
- Consider reserve SOV for guaranteed branded coverage during launches or competitive attacks.
For most sellers, the practical sequence is: 1) secure branded terms, 2) fix listing fundamentals, 3) expand category keyword coverage, 4) layer in DSP or reserve SOV once the basics are solid. Skipping straight to step four while your listing images are weak wastes budget that better creative would have earned back for free.
How Osellpa helps you measure and defend your SOV
Manually pulling impression data across keyword sets, marketplaces, and campaign types is the exact kind of task that eats a Tuesday afternoon and still leaves gaps. Osellpa connects directly to Amazon’s API to automate that pull, so SOV tracking runs continuously instead of whenever someone remembers to check.
- Automated SOV pulls across your keyword sets, refreshed without manual exports.
- Integration with Amazon’s advertising data for a more complete paid and organic picture.
- Top-of-search weighting built into how visibility is reported, not just raw impression counts.
- Automated alerts when SOV drops, so you catch a competitor’s move within days, not at month-end.
- PPC optimisation that adjusts bids automatically to help hold your target SOV without overspending.
The point isn’t just visibility for its own sake. It’s catching the drop before it becomes a lost sale, and doing it without another spreadsheet.
A weekly habit worth building
Reviewing SOV once a week, same day, same keyword set, catches problems while they’re still cheap to fix. A single-day dip rarely means anything; three consecutive weeks of decline on a category term almost always does.

Pro Tip: Separate short-term auction noise from structural loss by checking whether the dip is isolated to one keyword or spreading across your whole category set. Isolated dips are usually a bidding issue; spreading ones usually mean a competitor has changed strategy.
Ready to stop guessing at your Amazon visibility?
Spreadsheets and manual exports can get you a rough SOV figure once a month. They can’t tell you the moment a competitor starts eating into your branded terms, and they won’t adjust your bids while you’re asleep. Osellpa automates the pulls, applies top-of-search weighting automatically, and optimises PPC spend to hold your target SOV without you manually checking dashboards every morning. If you also want to widen the lens beyond Amazon’s own reporting, tools like Prowl can layer in broader market-intelligence feeds alongside your SOV data. Start a trial with Osellpa and see your current SOV position within minutes of connecting your account.
Frequently asked questions
What counts as a good SOV on Amazon? There’s no universal number, but industry benchmarks suggest 20–30% represents a solid holding position in a competitive category, while 40–50% typically signals category leadership.
Technically yes, if you’re the only seller for an exact-match keyword, but it’s rare in any competitive category and usually not worth chasing across broad terms.
Is paid SOV or organic SOV more important? Neither matters in isolation. Paid SOV shows how well your ad budget is performing right now; organic SOV shows whether your listing quality is improving independent of spend. Track both separately for a clear diagnosis.
Does reserve share of voice cost more than standard Sponsored Brands campaigns? It carries a fixed upfront price rather than a variable auction cost, which can mean paying more per impression during low-competition periods but protects you from bid inflation during high-competition windows.
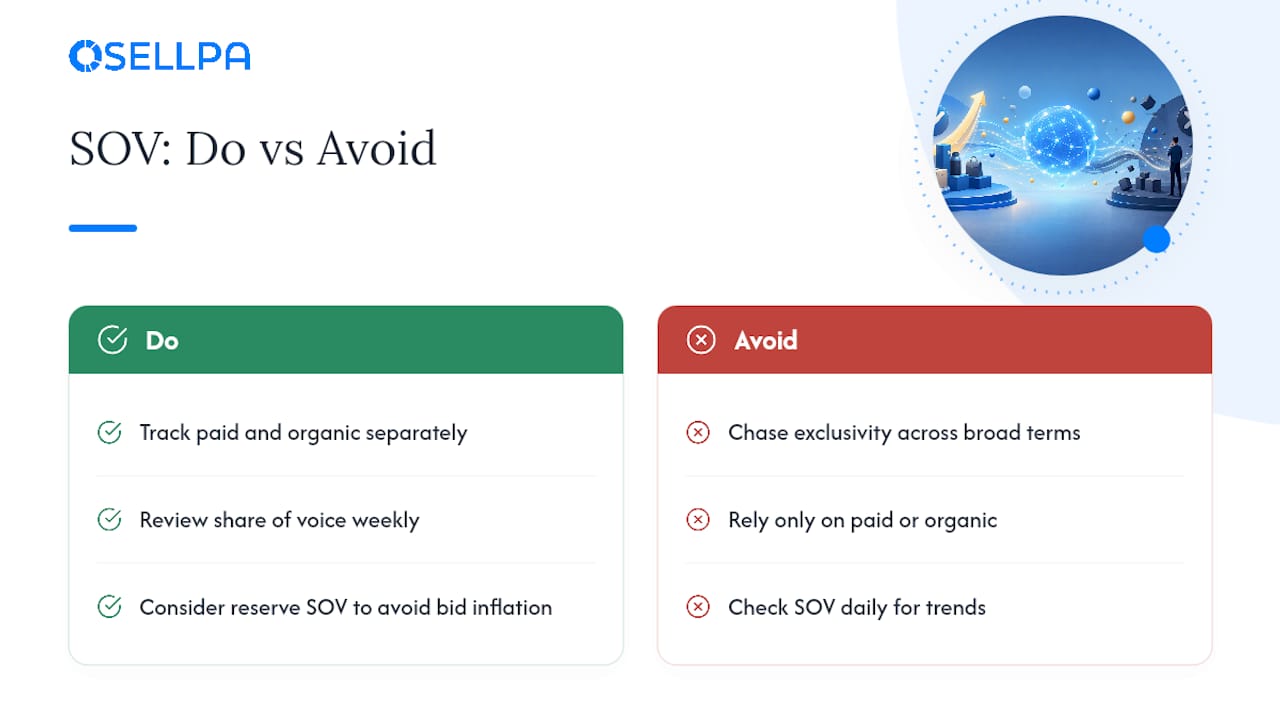
How often should sellers check their SOV? Weekly reviews catch structural declines before they compound, while daily checks mostly reveal auction noise rather than meaningful trends.


