
Your Amazon FBA sell-through rate (STR) is units shipped in the last 90 days divided by your average units on hand in FBA over that same period. A ratio above 1 means you’re selling faster than you’re holding stock; below 1 means inventory is piling up faster than it moves. Amazon bands this metric as Poor, Fair, Good or Excellent, and the number sits directly inside your Inventory Performance Dashboard.
Check yours now:
- Go to Seller Central, open Inventory Performance, and look for the STR figure under your Inventory Performance Index score.
- Compare it against the benchmark bands below before you touch pricing or PPC.
- If you’re managing several SKUs, a tool like Osellpa can flag falling STR alongside profit-per-unit, so you’re not just watching a number in isolation.
Pro Tip: A single Poor-rated SKU can drag down your account-level score even when your best sellers are Excellent, so always check per-SKU views, not just the headline figure.
Key Takeaways
Amazon’s sell-through rate divides 90-day shipped units by average on-hand inventory, and keeping most SKUs in the Good band protects both your Inventory Performance Index and your margin.
| Point | Details |
|---|---|
| Know the exact formula | STR equals units shipped in 90 days divided by average units on hand in that window. |
| Target the Good band | Aim for a 3 to 7 STR; below 1 risks storage fees, above 7 risks stockouts. |
| Fix stranded inventory first | Stranded listings drag both STR and IPI, and resolving them works within days. |
| Set targets by SKU, not account-wide | Use 30 to 60 days of supply as a guide, adjusted for lead time and margin. |
| Monitor STR alongside profit | Osellpa pairs STR-relevant stock signals with profit-per-unit and PPC data in one dashboard. |
Table of Contents
- What sell-through rate actually measures on Amazon
- Finding your STR inside Seller Central
- What counts as a good sell-through rate
- How STR feeds into IPI, restock limits and storage fees
- The fastest ways to lift your sell-through rate
- Setting the right STR target for each SKU
- Turning STR into a profit decision, not just a dashboard number
- What the numbers actually tell you about running a healthy FBA business
- Monitor STR without losing sight of profit
- Frequently asked questions
- Sources
What sell-through rate actually measures on Amazon
Retailers outside Amazon usually talk about sell-through as a percentage: units sold divided by units received, over a season or a fixed stocking period. Amazon’s version is different. It’s a rolling 90-day ratio, not a percentage, and it recalculates continuously rather than resetting at the end of a defined cycle. That distinction trips up a lot of sellers who arrive expecting a tidy percentage and instead see a number like 4.2.
The rolling window creates a lag effect worth understanding before you panic over a dip.
- Amazon takes your total units shipped from FBA over the trailing 90 days.
- It divides that by your average on-hand units across the same window.
- A large inbound shipment inflates the denominator immediately, but the numerator (units shipped to customers) only catches up as sales happen.
Say you’re selling 300 units a month with 600 units in FBA. Your STR sits around 1.5, a Fair reading. Then you send in a fresh shipment of 1,200 units to cover the next quarter. Your average on-hand jumps overnight, but your sales pace hasn’t changed yet, so STR temporarily craters, sometimes into Poor territory, for several weeks. This isn’t a sign anything’s gone wrong. It’s the mechanical result of a bigger denominator meeting the same sales rate, and it corrects itself as the new stock sells through.
Finding your STR inside Seller Central
Your STR lives inside the Inventory Performance Dashboard, and Amazon shows it at two levels that matter for different decisions.
- Account level: the headline figure that feeds your Inventory Performance Index (IPI) score, found near the top of the dashboard.
- Per-SKU level: click into individual products to see their own STR, alongside days of supply and units available.
- Historical panels: Amazon shows 30-day and 90-day views so you can see whether a dip is a blip or a trend.
- Days of supply: sits next to STR in the same dashboard and tells you roughly how many days your current stock will last at the recent sales pace.
Amazon updates these figures regularly, but not instantly. If you’ve just completed a large check-in, expect the account-level number to look worse before it looks better. That’s the rolling-window lag doing exactly what it’s designed to do, not a system error. The per-SKU view is where you’ll actually act. Account-level STR tells you whether IPI is at risk; SKU-level STR tells you which specific product needs a removal, a promotion or a reorder.
What counts as a good sell-through rate
Amazon’s own guidance sorts STR into four bands, and knowing where your SKUs sit changes what you should do next.
| Band | STR range | What it typically means |
|---|---|---|
| Poor | Below 1 | Stock is accumulating faster than it sells; storage and IPI risk rising |
| Fair | 1 to 2 | Moving, but slowly; worth reviewing pricing or ad spend |
| Good | 3 to 7 | Healthy balance between sales pace and stock cover |
| Excellent | Above 7 | Selling very fast; watch for stockout risk |
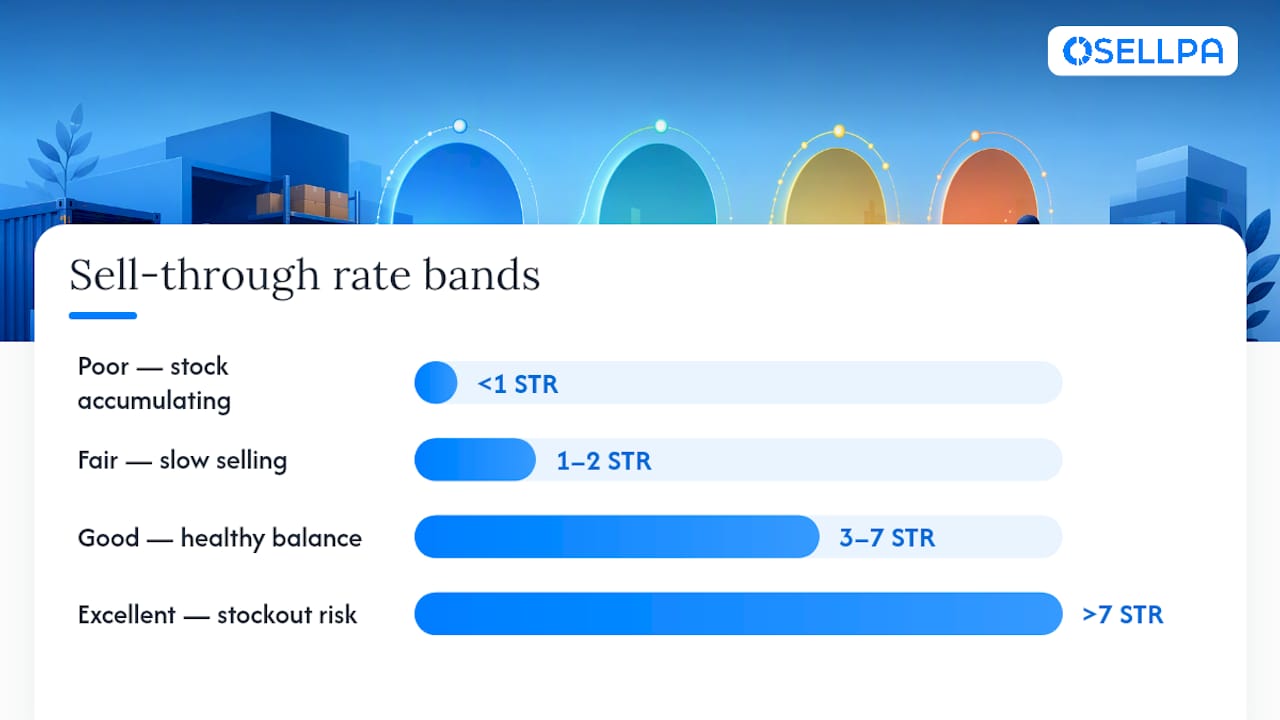
Most experienced sellers treat the Good band as the practical sweet spot, because it balances two competing risks. Sit too low and you’re tying up capital in stock that isn’t moving, exposing yourself to long-term storage fees. Sit too high, particularly above 7, and you risk running out before your next shipment lands, which costs you the Buy Box and organic ranking momentum you’ve built. An Excellent rating looks impressive on a dashboard, but if it means you’re perpetually one delayed container away from an out-of-stock listing, it isn’t actually the healthiest position.
How STR feeds into IPI, restock limits and storage fees
Sell-through rate isn’t a standalone vanity metric. It’s one of four inputs into your Inventory Performance Index, alongside excess inventory percentage, stranded inventory and in-stock rate. A weak score in any one of these drags the whole IPI down, and IPI is what Amazon uses to decide how much FBA capacity you’re allowed.
- Stranded inventory (units with listing errors that can’t be sold) counts against you even though it isn’t technically “excess” stock.
- A falling IPI score can trigger tighter restock limits, meaning Amazon simply won’t let you send in as much inventory until your metrics recover.
- Persistently low STR increases your exposure to long-term storage surcharges, which Amazon applies to units that have sat in a fulfilment centre beyond a set threshold.
- Fixing stranded listings and clearing aged stock improves STR and IPI simultaneously, since both problems often share the same root cause.
Sellers who treat IPI as four separate boxes to tick usually fix the wrong thing first. STR responds fastest to clearing stranded and aged inventory, not to chasing more sales volume on SKUs that are already moving fine.
The practical takeaway: if your restock limits feel tighter than they used to be, don’t assume Amazon is being arbitrary. Pull up your IPI breakdown and check whether STR is the component dragging the score down before you request a limit increase.
The fastest ways to lift your sell-through rate
Not every fix works on the same timeline, and treating a supplier renegotiation with the same urgency as a stranded listing wastes effort. Here’s the order that actually moves the number.
- Resolve stranded inventory immediately. These are units sitting in FBA with no live, sellable listing attached, usually because of a listing error, suppressed detail page or category mismatch. Fixing stranded inventory is typically a same-day or same-week action, and it directly improves both STR and IPI.
- File removal orders on genuinely dead stock. If a SKU has been sitting for months with no realistic path to selling out, removing or liquidating it stops it dragging your denominator down indefinitely. This takes days to arrange but weeks to fully process.
- Run targeted promotions on ageing but viable stock. Coupons, Lightning Deals and percentage-off promotions can clear slow movers within one to two weeks, converting dead weight into cash flow before it tips into long-term storage territory.
- Adjust PPC toward SKUs with excess stock. Redirecting ad spend to push units that are sitting too long is faster than waiting for organic sales to catch up, and it’s a lever you can pull within days.
- Right-size your next inbound shipment. Instead of sending three months of stock in one go, split shipments to match actual sales velocity. This smooths the denominator swings that cause temporary STR dips.
- Bundle slow movers with fast sellers. This works over weeks rather than days, but it shifts stock that wouldn’t sell on its own.
- Reduce supplier lead times where you can. This is the slowest fix, often months, but shorter lead times let you hold less safety stock overall, which structurally improves STR across your whole catalogue.
Pro Tip: Don’t launch a big promotion the week after a large inbound shipment lands unless you deliberately want to clear stock fast. Your STR will already look artificially low from the denominator jump, and a promotion on top of that can eat margin you didn’t need to give up.
Setting the right STR target for each SKU
Chasing the highest possible STR is a mistake dressed up as ambition. The goal is a sweet spot, not a maximum, and that sweet spot varies by product.
- Translate STR into days of supply: most sellers find 30 to 60 days of cover balances responsiveness with the risk of stockouts.
- Fast-moving core SKUs with short supplier lead times can run leaner, closer to 30 days, without much risk.
- Slow movers or products with long, unreliable lead times need more cushion, sometimes 60 days or beyond, even if that pulls their individual STR down.
- Keep a small safety-stock buffer for your best sellers so a delayed shipment doesn’t turn into a lost Buy Box.
Segmenting targets by margin and velocity, rather than applying one STR number account-wide, is what experienced sellers actually do once they’ve been burned by a stockout on a high-STR bestseller.
Turning STR into a profit decision, not just a dashboard number
STR only tells you half the story. A SKU can sit in the Good band and still lose money if ad spend is eating the margin, or returns are quietly climbing. The sellers who use STR well pair it with profit-per-unit, PPC spend and return rate in one view, rather than checking Seller Central for stock health and a spreadsheet for profitability separately.
Look for a few concrete features when choosing how to monitor this:
- Direct API integration with your Amazon account, so figures update without manual exports.
- SKU-level alerts that flag falling STR before it drags your account IPI down.
- Automated PPC rules that shift spend toward stock you need to clear.
- Removal-order triggers for stock that’s aged past a threshold you set.
Osellpa builds STR-adjacent signals directly into its profit dashboard, so a dip in sell-through shows up next to the margin and ad-spend numbers that actually determine whether it matters.
Pro Tip: A rising STR paired with falling profit-per-unit usually means you’ve discounted too hard to clear stock. Watch both metrics together, not one in isolation.
What the numbers actually tell you about running a healthy FBA business
Most advice on this topic treats sell-through rate as something to maximise, and that’s the part worth pushing back on. The research is fairly consistent: an Excellent rating feels good to see, but it’s often a warning sign wearing a compliment’s clothes. If you’re consistently above 7, you’re one shipping delay away from a stockout that costs you rank and reviews you won’t easily win back.
The conventional advice also underplays the lag effect. Sellers panic over a post-restock dip and launch discounts they didn’t need to run, cutting margin to fix a problem that was already correcting itself. Understanding the rolling 90-day mechanic isn’t a technicality. It’s the difference between a calm inventory decision and a reactive, margin-destroying one.
What should you prioritise first? Stranded inventory, every time. It’s the fastest fix, it improves STR and IPI simultaneously, and most sellers underestimate how much of it is sitting quietly in their account right now. Fix that before you touch pricing, promotions or supplier terms.
Monitor STR without losing sight of profit
Spreadsheets and the Inventory Performance Dashboard will tell you your STR, but neither tells you whether a stock clearance actually made you money. That’s the gap Osellpa closes. Instead of switching between Seller Central tabs and a manual profit tracker, you get sell-through signals, profit-per-unit, ad spend and return rates in one place, so a fix that improves your STR doesn’t quietly erode your margin.

Osellpa connects directly to your Amazon account through the API, so the numbers update without exports or manual reconciliation, and its automated PPC rules can redirect ad spend toward stock that needs to move faster. Sellers using the platform report sales increases of up to 20% once profit visibility and automation replace guesswork. If you’re managing more than a handful of SKUs, start a trial and see your STR sitting next to the profit figures that actually decide whether it’s worth chasing.
Frequently asked questions
What is a good sell-through rate on Amazon? Most guidance places the Good band between 3 and 7. Below 1 is Poor and signals accumulating stock; above 7 is Excellent but carries stockout risk.
How often does Amazon update the sell-through rate figure? Seller Central refreshes it regularly, though a large inbound shipment can temporarily distort the number for several weeks before it settles.
Does a low sell-through rate always mean poor sales? Not necessarily. A recent large restock inflates your average on-hand units immediately, which can push STR down even when your sales pace hasn’t changed.
Can sell-through rate affect my restock limits? Yes. STR is one of four inputs into your Inventory Performance Index, and a weak IPI score can tighten how much inventory Amazon allows you to send into FBA.
Is Amazon’s sell-through rate the same as retail sell-through percentage? No. Retail sell-through is usually a percentage over a fixed period, while Amazon’s version is a rolling 90-day ratio of shipped units to average on-hand stock.


