
Search Query Performance is Amazon Brand Analytics’ query-level funnel: impressions, clicks, cart adds, and purchases mapped against the exact search term a shopper typed. It shows you precisely where search-driven customers drop out of your buying journey.
The single most valuable move you can make with this data: check your high-impression, low-click queries first. If a term shows thousands of impressions but a thin click count, your listing is showing up in front of buyers and failing to earn the tap. That’s a search-results problem, not a product-detail problem, and fixing the wrong one wastes weeks.
You’ll see two other names throughout this guide: the Selling Partner API (SP-API), which now delivers this data programmatically, and Osellpa, which automates what most sellers do manually.
- Impressions → clicks → cart adds → purchases: read the funnel in that order
- High impressions + low clicks = fix your title, image, or price first
- The SP-API now exposes this report for automated, continuous monitoring
Key Takeaways
Search Query Performance data reveals exactly which funnel stage, search results, product page, or checkout, is costing you customers on every tracked keyword.
| Point | Details |
|---|---|
| Diagnose before spending | Check high-impression, low-click queries first; a listing fix often beats extra ad spend. |
| Read the funnel in order | CTR, cart add rate, and purchase rate each point to a different fix: images, content, or price. |
| Separate branded and unbranded | The two query types behave differently and blending them hides real problems. |
| Mind the attribution window | SQP’s 24-hour attribution window means it won’t match your standard sales reports. |
| Automate at scale | Osellpa pulls SQP data via Amazon’s API and adjusts campaigns automatically as signals shift. |
Table of Contents
- What the search query performance report actually contains
- Where to find your search query performance data
- Reading search query performance as a diagnostic funnel
- Turning search query performance into listing and ad decisions
- Building dashboards and alerts from your search query performance feed
- What search query performance data won’t tell you
- Applying search query performance data without drowning in spreadsheets
- Three priorities to act on this week
- Let Osellpa handle the search query performance monitoring
- Frequently asked questions
- Sources
What the search query performance report actually contains
Each row in the report represents one search term, broken down into metrics that describe shopper behaviour at every funnel stage. Impressions count how often your ASIN appeared in results for that query. Clicks count how many shoppers tapped through. Cart adds and purchases track further down the funnel, and Amazon counts a purchase as a single event per customer order, regardless of how many units they bought.
The report also breaks out median price, shown both for your product and for the wider market on that query, plus a shipping speed distribution showing how fast competing offers promised delivery at the moment of impression.
Statistic: The SP-API’s Search Query Performance report, added on 26 February 2025, returns impressions, clicks, cart adds, and purchases directly through the API, covering the full set of supported marketplaces.
A few practical notes on reading these columns:
- A high median price gap versus the market often explains poor conversion even with strong clicks
- Slower shipping speed than competing offers can suppress cart adds in speed-sensitive categories
- Purchases lag clicks by design, so a short date range can understate true conversion
Where to find your search query performance data
You can pull the report manually inside Seller Central, or automate it through the SP-API. Both routes return the same underlying data; the difference is speed and repeatability.
- Log into Seller Central and navigate to Brands, then Brand Analytics, then Search Analytics, then Search Query Performance. This path requires Brand Registry enrolment, since the report sits inside the Brand Analytics suite.
- For manual analysis, download the weekly or monthly CSV. This is enough if you’re reviewing a handful of ASINs or doing a one-off diagnostic.
- For ongoing monitoring, use the SP-API endpoint added in 2025. It returns the same impressions, clicks, cart adds, and purchase figures on a schedule you control, which matters once you’re tracking dozens of ASINs across categories.
If you manage a small catalogue and check performance monthly, the UI is fine. Past ten or so tracked ASINs, manual downloads become the bottleneck, not the analysis itself.
Reading search query performance as a diagnostic funnel
Three simple ratios turn a spreadsheet of numbers into a prioritised action list: click-through rate (clicks ÷ impressions), cart add rate (cart adds ÷ clicks), and purchase rate (purchases ÷ cart adds). Run these across your top queries by impression volume, and the failure points become obvious fast.
Low CTR usually means your listing isn’t winning the visual competition on the search results page. Shoppers see you, and scroll past. First tests: swap your main image against your top three competitors’, rewrite your title to lead with the benefit that matches the query intent, and check whether your price sits noticeably above the median for that search term.
Low cart add rate (good clicks, weak cart adds) points to the product detail page itself. Shoppers clicked because the listing looked promising, then hesitated. Test your secondary images, your bullet copy, and your review count versus competitors on that same query.
Low purchase rate (cart adds that don’t convert) often traces back to price or fulfilment friction at checkout. Run a controlled price test, or trial Fulfilment by Amazon if you’re currently using FBM in a category where shipping speed clearly influences the buy box.
- Low CTR: test image, title, and price against the query’s market median
- Low cart add rate: audit secondary images, bullets, and review volume
- Low purchase rate: test price sensitivity and delivery speed
Pro Tip: Run this funnel check separately for branded and unbranded versions of the same core term. A branded search for “Osellpa profit tracker” behaves nothing like the generic “Amazon seller software” query, and blending the two will hide real problems in both.
Turning search query performance into listing and ad decisions
The report earns its keep when it drives specific changes to your listings and campaigns, not just weekly reading.
- Hunt for under-served queries. Look for search terms with rising impressions but low click share relative to your category peers. These are keywords worth chasing in both organic copy and Sponsored Products targeting before competitors notice the gap.
- Decide between listing fixes and ad spend. If a query has strong CTR but weak purchase rate, more ad spend just buys you more of the same disappointing conversion. Fix the listing first. If CTR is the weak link but purchase rate is healthy once shoppers land, you may be under-bidding for visibility rather than facing a content problem.
- Map signals to bid strategy. High-impression, high-purchase-rate queries deserve tighter, higher bids in Sponsored Products, since you already know they convert. Sponsored Brands campaigns work better on queries showing strong click share but where you want to defend or grow share of voice against a competitor gaining ground on the same term, a use case detailed in practitioner analysis of the SQP report.
- Recheck monthly. Query behaviour shifts with seasonality and competitor activity, so a keyword that was under-served in January can be crowded by April.
This sequencing matters: sellers who throw ad budget at every low-converting query before diagnosing why it’s underperforming tend to burn spend without moving the needle.
Building dashboards and alerts from your search query performance feed
Once you’re pulling data through the SP-API rather than downloading CSVs by hand, the natural next step is a dashboard that updates itself. Microsoft Power BI connects directly to API feeds and CSV exports alike, letting you build recurring visualisations without manually rebuilding pivot tables each week. Microsoft Excel remains a solid choice if you’re working with a smaller catalogue, since its pivot tables handle SQP data cleanly for ad-hoc diagnostics.
At minimum, visualise impressions, clicks, cart adds, and purchases by query over time, alongside your calculated CTR, cart add rate, and purchase rate.
Statistic: Power BI is widely used for exactly this kind of CSV-to-dashboard workflow, making it a practical first step for sellers moving beyond spreadsheet-only analysis.
Set alerts before you need them, not after a bad week:
- Flag any top-20 query where click share drops more than a set threshold week over week
- Flag sudden purchase rate declines on high-volume terms, a common early sign of a competitor price cut
- Flag new queries entering your top 50 by impressions, so you catch emerging demand early
Automating these pulls turns a reactive weekly check into continuous monitoring, which is the real value of the 2025 API update.
What search query performance data won’t tell you
SQP is powerful, but it has hard edges you need to plan around. The report uses a strict 24-hour attribution window, meaning a purchase only counts against a search query if it happens within a day of that click. Longer consideration journeys, especially for higher-priced items, will show fewer purchases in SQP than your actual sales report reflects.
The data is also search-origin only. It excludes traffic from off-Amazon sources, some sponsored ad placements, and direct navigation to your listing.
- Don’t reconcile SQP purchase counts against your P&L; they’re built for different purposes
- Always compare branded and unbranded queries separately, since attribution behaviour differs between them
- Use matching date ranges when cross-referencing SQP against Sponsored Products reports
Treat SQP as your funnel signal, not your revenue ledger, and the numbers stop feeling contradictory.
Applying search query performance data without drowning in spreadsheets
Osellpa integrates directly with Amazon’s API to pull this funnel data automatically rather than requiring weekly manual downloads, and its automated campaign management adjusts bids based on the same CTR and purchase-rate signals covered above. Sellers using its tools report notable sales increases after implementation.
A DIY approach with Power BI or Excel works well if you’re managing a small catalogue and have time to build and maintain your own dashboard logic. Once you’re tracking dozens of ASINs across shifting query sets, an automated tool that reacts to funnel signals in real time starts saving more hours than it costs.
- DIY dashboards suit small catalogues with spare analytical time
- Automated tools suit sellers scaling past manual monitoring capacity
Three priorities to act on this week
Run a CTR diagnostic on your ten highest-impression queries before touching anything else. Compare your median price and shipping speed against the market figures for each. Then ask yourself honestly whether an automated dashboard would save you more hours this month than it costs to set up.
Let Osellpa handle the search query performance monitoring
Building your own Power BI dashboard or maintaining an Excel workbook works until your catalogue grows past what one person can watch weekly. Osellpa connects directly to Amazon’s API to pull impressions, clicks, cart adds, and purchase data automatically, then adjusts your Sponsored Products and Sponsored Brands bids based on the same funnel signals covered in this guide, without you rebuilding a spreadsheet every Monday. It pairs that automation with clear profit tracking, so you see the sales impact of every listing or bid change alongside your actual margin, not just top-line revenue. If you’re ready to stop reacting to weekly CSV exports and start monitoring your funnel continuously, start with Osellpa and see your search query data working for you within your first week.
Frequently asked questions
What is Search Query Performance on Amazon? It’s a Brand Analytics report showing impressions, clicks, cart adds, and purchases for every search term connected to your ASINs, giving you a query-level view of your search funnel.
Do I need Brand Registry to access the SQP report? Yes. The report sits inside Brand Analytics, which requires Brand Registry enrolment before it appears in Seller Central.
Why don’t my SQP purchase numbers match my sales reports? SQP uses a strict 24-hour attribution window, so purchases from longer shopping journeys or off-Amazon traffic won’t appear in the report, even though they show up in your standard sales figures.
Can I pull search query performance data automatically? Yes. The Selling Partner API added a dedicated Search Query Performance endpoint in February 2025, letting you automate the pulls that previously required manual CSV downloads.
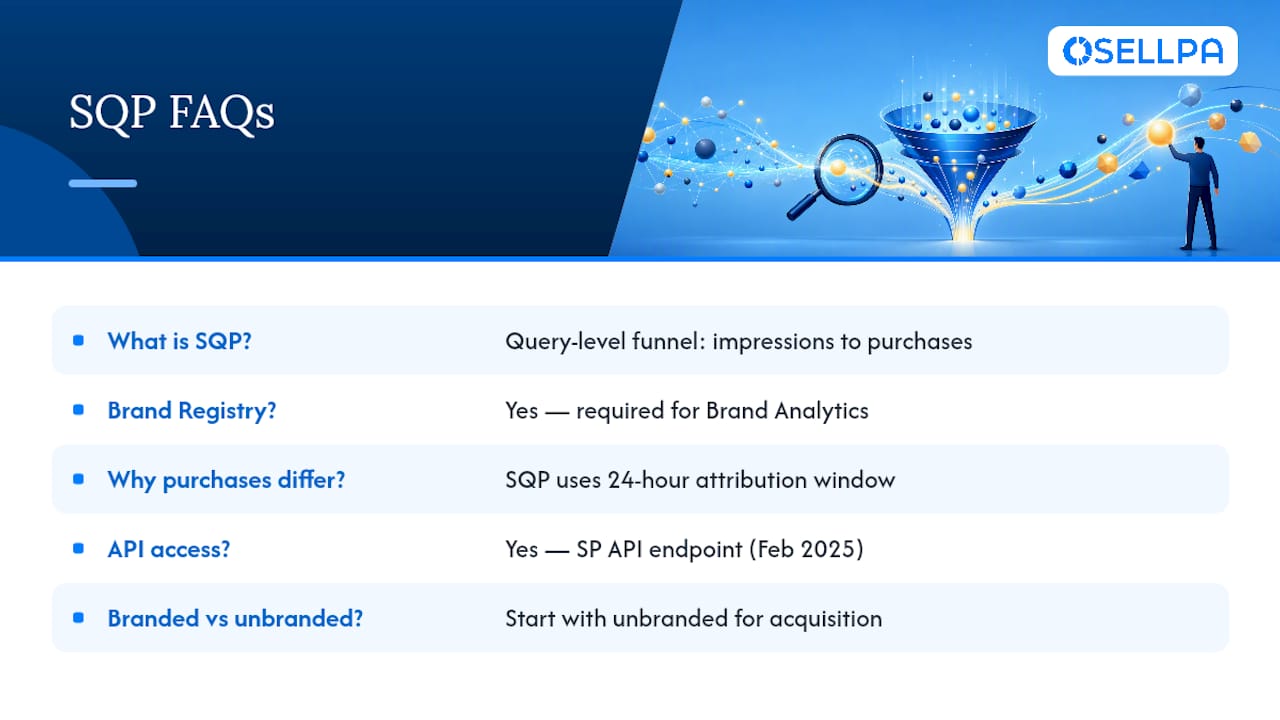
Should I focus on branded or unbranded search queries first? Start with unbranded queries if you’re trying to grow new customer acquisition, since branded searches already reflect existing demand for your product rather than new discovery.


