
Amazon Brand Analytics keyword data pairs marketplace demand with your brand’s own performance. Top Search Terms shows what shoppers search for across the whole marketplace, ranked by Search Frequency Rank. Search Query Performance shows how your brand does when those searches happen: impressions, clicks, and purchases. Used together, they tell you exactly what to fix first.
If you only do two things this week:
- Export Top Search Terms for your category and note the Search Frequency Rank on your priority keywords.
- Open Search Query Performance and check your brand’s click share and conversion share on those same terms.
Both reports sit inside Seller Central under Brand Analytics, and both require an active Brand Registry enrolment to view.
Key Takeaways
Pairing Top Search Terms demand data with Search Query Performance brand data, then filtering both through a click-share and conversion-share diagnostic, is the fastest route from raw keyword exports to revenue-moving listing and PPC decisions.
| Point | Details |
|---|---|
| Combine both reports | Use Top Search Terms for demand and Search Query Performance for your brand’s actual capture of it. |
| Treat SFR as rank, not volume | Track weekly movement rather than reacting to a single static Search Frequency Rank number. |
| Diagnose before you spend | Split click share from conversion share to know whether you have a traffic problem or a listing problem. |
| Run a weekly cadence | Export, classify, and assign two to four actions per sprint rather than tackling every term at once. |
| Automate the repetitive parts | Osellpa syncs Amazon’s API to pull both reports, score priorities, and adjust PPC without manual spreadsheets. |
Primary sources and official documentation
For the underlying dashboards and metric definitions, see Amazon’s own Brand Analytics overview and the detailed Top Search Terms guide.
Table of Contents
- What Brand Analytics reports contain keyword data
- Top Search Terms vs Search Query Performance: how to use each
- Reading SFR, click share and conversion share: a 2×2 diagnostic
- Building a weekly keyword prioritisation workflow
- How to export and organise your CSV data
- Turning priorities into listing and PPC changes
- Where automation fits into the Top Search Terms and Search Query Performance workflow
- Sources
What Brand Analytics reports contain keyword data
Three dashboards matter most for keyword work, and each answers a different question.
- Top Search Terms shows marketplace-wide popularity through Search Frequency Rank, plus the top three clicked ASINs for each search term and their click share and conversion share.
- Search Query Performance shows impressions, clicks, add-to-cart events, and purchases for every query where your own brand’s products appeared, whether you ranked first or fifteenth.
- Search Catalog Performance and a handful of other panels (repeat purchase behaviour, demographics, market basket data) round out the full Brand Analytics suite, though they matter less for pure keyword prioritisation.
Top Search Terms tells you what the market wants. Search Query Performance tells you whether your brand is actually getting a fair slice of it. Confuse the two and you’ll spend a week optimising for demand you already own, or ignoring demand you’re losing badly.
Top Search Terms vs Search Query Performance: how to use each
Top Search Terms is discovery. It tells you what customers type into the search bar platform-wide, independent of whether your products show up at all. Search Query Performance is diagnosis. It tells you how your brand performs once that search happens, down to the ASIN.
The right sequence is to use Top Search Terms to spot demand gaps, then check Search Query Performance to see exactly where you’re underperforming against that demand.
Watch for three common misreads:
- Treating Search Frequency Rank as a raw search count. It’s an ordinal position, not a volume figure.
- Assuming high click share means you’re winning. Check conversion share too. Clicks without purchases mean the listing is losing the sale.
- Comparing your Search Query Performance numbers against a different time window than your Top Search Terms export. Match the date ranges or the comparison is meaningless.
Building a weekly keyword prioritisation workflow
Turning Brand Analytics keyword data into action needs a repeatable process, not a one-off spreadsheet exercise.
- Export Top Search Terms for your category, filter to a Search Frequency Rank cut-off around 50,000, and strip out anything irrelevant to what you actually sell.
- Cross-check each surviving term in Search Query Performance, pulling your brand’s click share and conversion share for that exact query.
- Classify each term using the 2×2 matrix above and assign a concrete task: a title or main image rewrite for a click-share problem, a price or review push for a conversion-share problem, a PPC test for a capture opportunity, or simply monitoring for a defend position.
A sensible cadence:
- Export both reports weekly, on the same day, so week-on-week movement is comparable.
- Review the classified list monthly with whoever owns listings and whoever owns PPC.
- Assign the top three or four actions as a two-week sprint rather than trying to fix everything at once.
Trying to act on fifty keywords simultaneously is how most sellers abandon this process by week three. Pick the handful that move revenue and leave the rest for the next sprint.
How to export and organise your CSV data
Both reports live under Brand Analytics in Seller Central, accessible through the Brands menu once your account is Brand Registry enrolled. Each dashboard has a download button that produces a CSV for a selected date range.
A minimal spreadsheet template needs just five columns to be useful:
- Search term and its category
- This week’s Search Frequency Rank
- Last week’s Search Frequency Rank (for movement)
- Your brand’s click share and conversion share
- Assigned action and owner
Use a simple filter or pivot table to sort by Search Frequency Rank movement rather than absolute value. A term jumping from rank 40,000 to rank 12,000 in a month deserves more attention than a stable term sitting at rank 5,000. Archive each week’s export in a dated folder. Six months of history turns a single snapshot into a genuine trend line.
Turning priorities into listing and PPC changes
Diagnosis only pays off once it changes the listing or the campaign.
- Place priority keywords in the title and the first two bullet points, but only where they accurately describe the product. Stuffing a term that doesn’t match the item damages conversion share further.
- If Search Query Performance shows a click-share problem, test image and title changes, and run a controlled advertising split test to confirm the fix moved impressions into clicks.
- If it’s a conversion-share problem, A/B test bullet copy or pricing before touching the ad campaign at all. Ads can’t fix a listing that fails to close the sale once someone lands on it.
- Give any change two to three weeks before judging it. Amazon’s search algorithm needs time to reindex a changed listing, and small sample sizes make early data noisy.
Measure the result against three figures: click-through rate lift, movement in click share, and movement in conversion share, then translate that into revenue impact. A five-point conversion share gain on a term ranked in the core category band can outweigh a much bigger click share gain on a long-tail term nobody searches for often.
Where automation fits into the Top Search Terms and Search Query Performance workflow

Manual exports work at small scale. Once you’re tracking fifty or more terms across several ASINs, the weekly download-filter-classify cycle eats hours you could spend on the actions themselves.
Automation earns its keep on the repetitive parts:
- Pulling both reports on schedule instead of remembering to log in each week
- Matching Top Search Terms entries back to Search Query Performance rows automatically
- Scoring terms against a 2×2-style priority model without manual spreadsheet work
- Triggering PPC rule changes the moment a capture opportunity or listing problem is confirmed
Direct API-level integration also removes the lag of manual CSV downloads, giving you closer to real-time signals rather than last Tuesday’s snapshot. Osellpa connects to Amazon’s API to handle exactly this loop, pairing profit tracking with PPC optimisation so keyword priorities turn into campaign changes automatically.
A short, practical note from someone who’s watched too many spreadsheets go stale
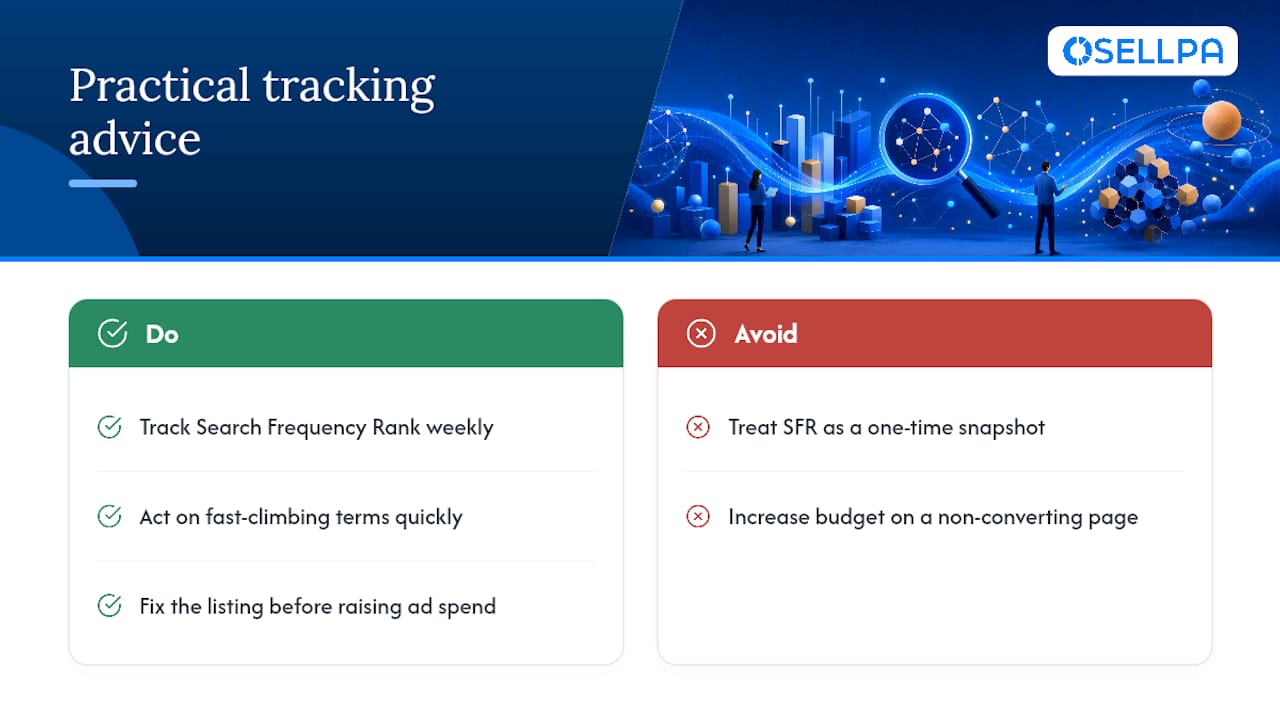
The single change that helps most: stop treating Search Frequency Rank as a snapshot and start tracking its weekly movement. A term climbing fast tells you more than any static number ever will.
Pro Tip: Fix the listing before you touch the ad budget. Spending more on a page that doesn’t convert just buys you a bigger loss.
— Harry
Letting Osellpa run the weekly grind for you
Running the Top Search Terms and Search Query Performance workflow by hand is manageable for one ASIN and painful for twenty. Osellpa syncs directly with Amazon’s API to pull both reports automatically, score keywords against a priority model like the one above, and adjust PPC campaigns when a capture opportunity or listing problem shows up, without you rebuilding a spreadsheet every Monday. If you’re currently doing this workflow by hand, the fastest way to see the difference is to try Osellpa and let it run your next weekly export automatically.


